Opta Forum 2026 · Category: Recruitment

Under Pressure,
Out of Context

Glass-Box Decision Profiles for Recruitment Risk Assessment.
A framework that measures passing decision quality — not execution outcomes — across five orthogonal dimensions derived from Opta Vision MA36, MA58, and MA60.

309 qualifying players 51,469 pass events 470K option comparisons 5 orthogonal metrics 4 pre-registered hypotheses — all confirmed ✓

The Problem

The transfer risk blind spot

Standard recruitment metrics — completion%, progressive passes, key passes — measure execution outcomes. A player completing 87% in a low-intensity league and 61% in a high-pressing one may be making identical decisions. Your metric cannot tell them apart.

The surface metrics trap: high completion% under a protective tactical system inflates value assessments. The collapse happens after signing, when the system changes. This framework makes it visible beforehand.

ρ=0.502
DQI ↔ Completion%
correlated, not redundant
ΔR²=0.071
DQI explains beyond
completion%
33.8%
Bottom-DQI turnover
under high pressure
17.5%
Top-DQI turnover
under high pressure
31.9%
Players amber/red UPDD
invisible in standard screens
r_rb=−0.858
DQI ↔ turnover
rank-biserial effect
"Completion% is not decision quality. It is decision quality × context × luck — bundled, unlabelled."
DQI vs Completion% scatter
DQI vs Completion% — the diagnostic gap
ρ=0.502 — correlated but not redundant. Residuals expose hidden value profiles (good decisions, modest completion%) and system risk profiles (inflated completion%, poor option selection).
DQI by pressure band
Decision quality collapses under pressure
Population-level DQI drop from low to high pressure. Cohen's d ≈ 0.556 — medium effect. Individual heterogeneity is the recruitment signal: some collapse, some improve. Standard metrics detect neither.

Method

Five orthogonal metrics from Opta Vision

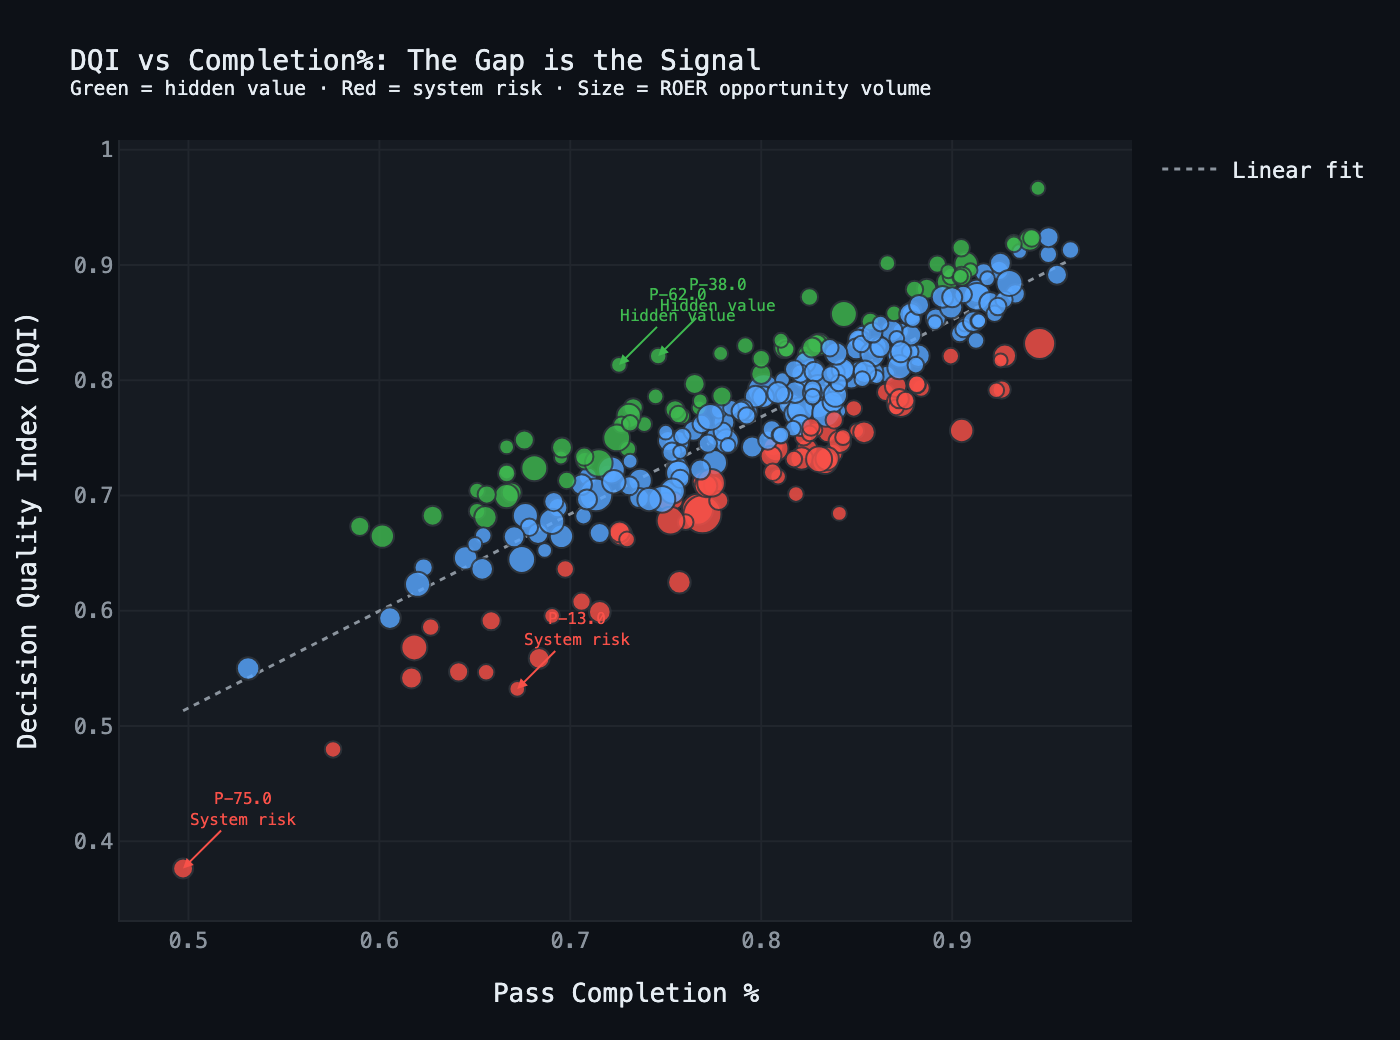
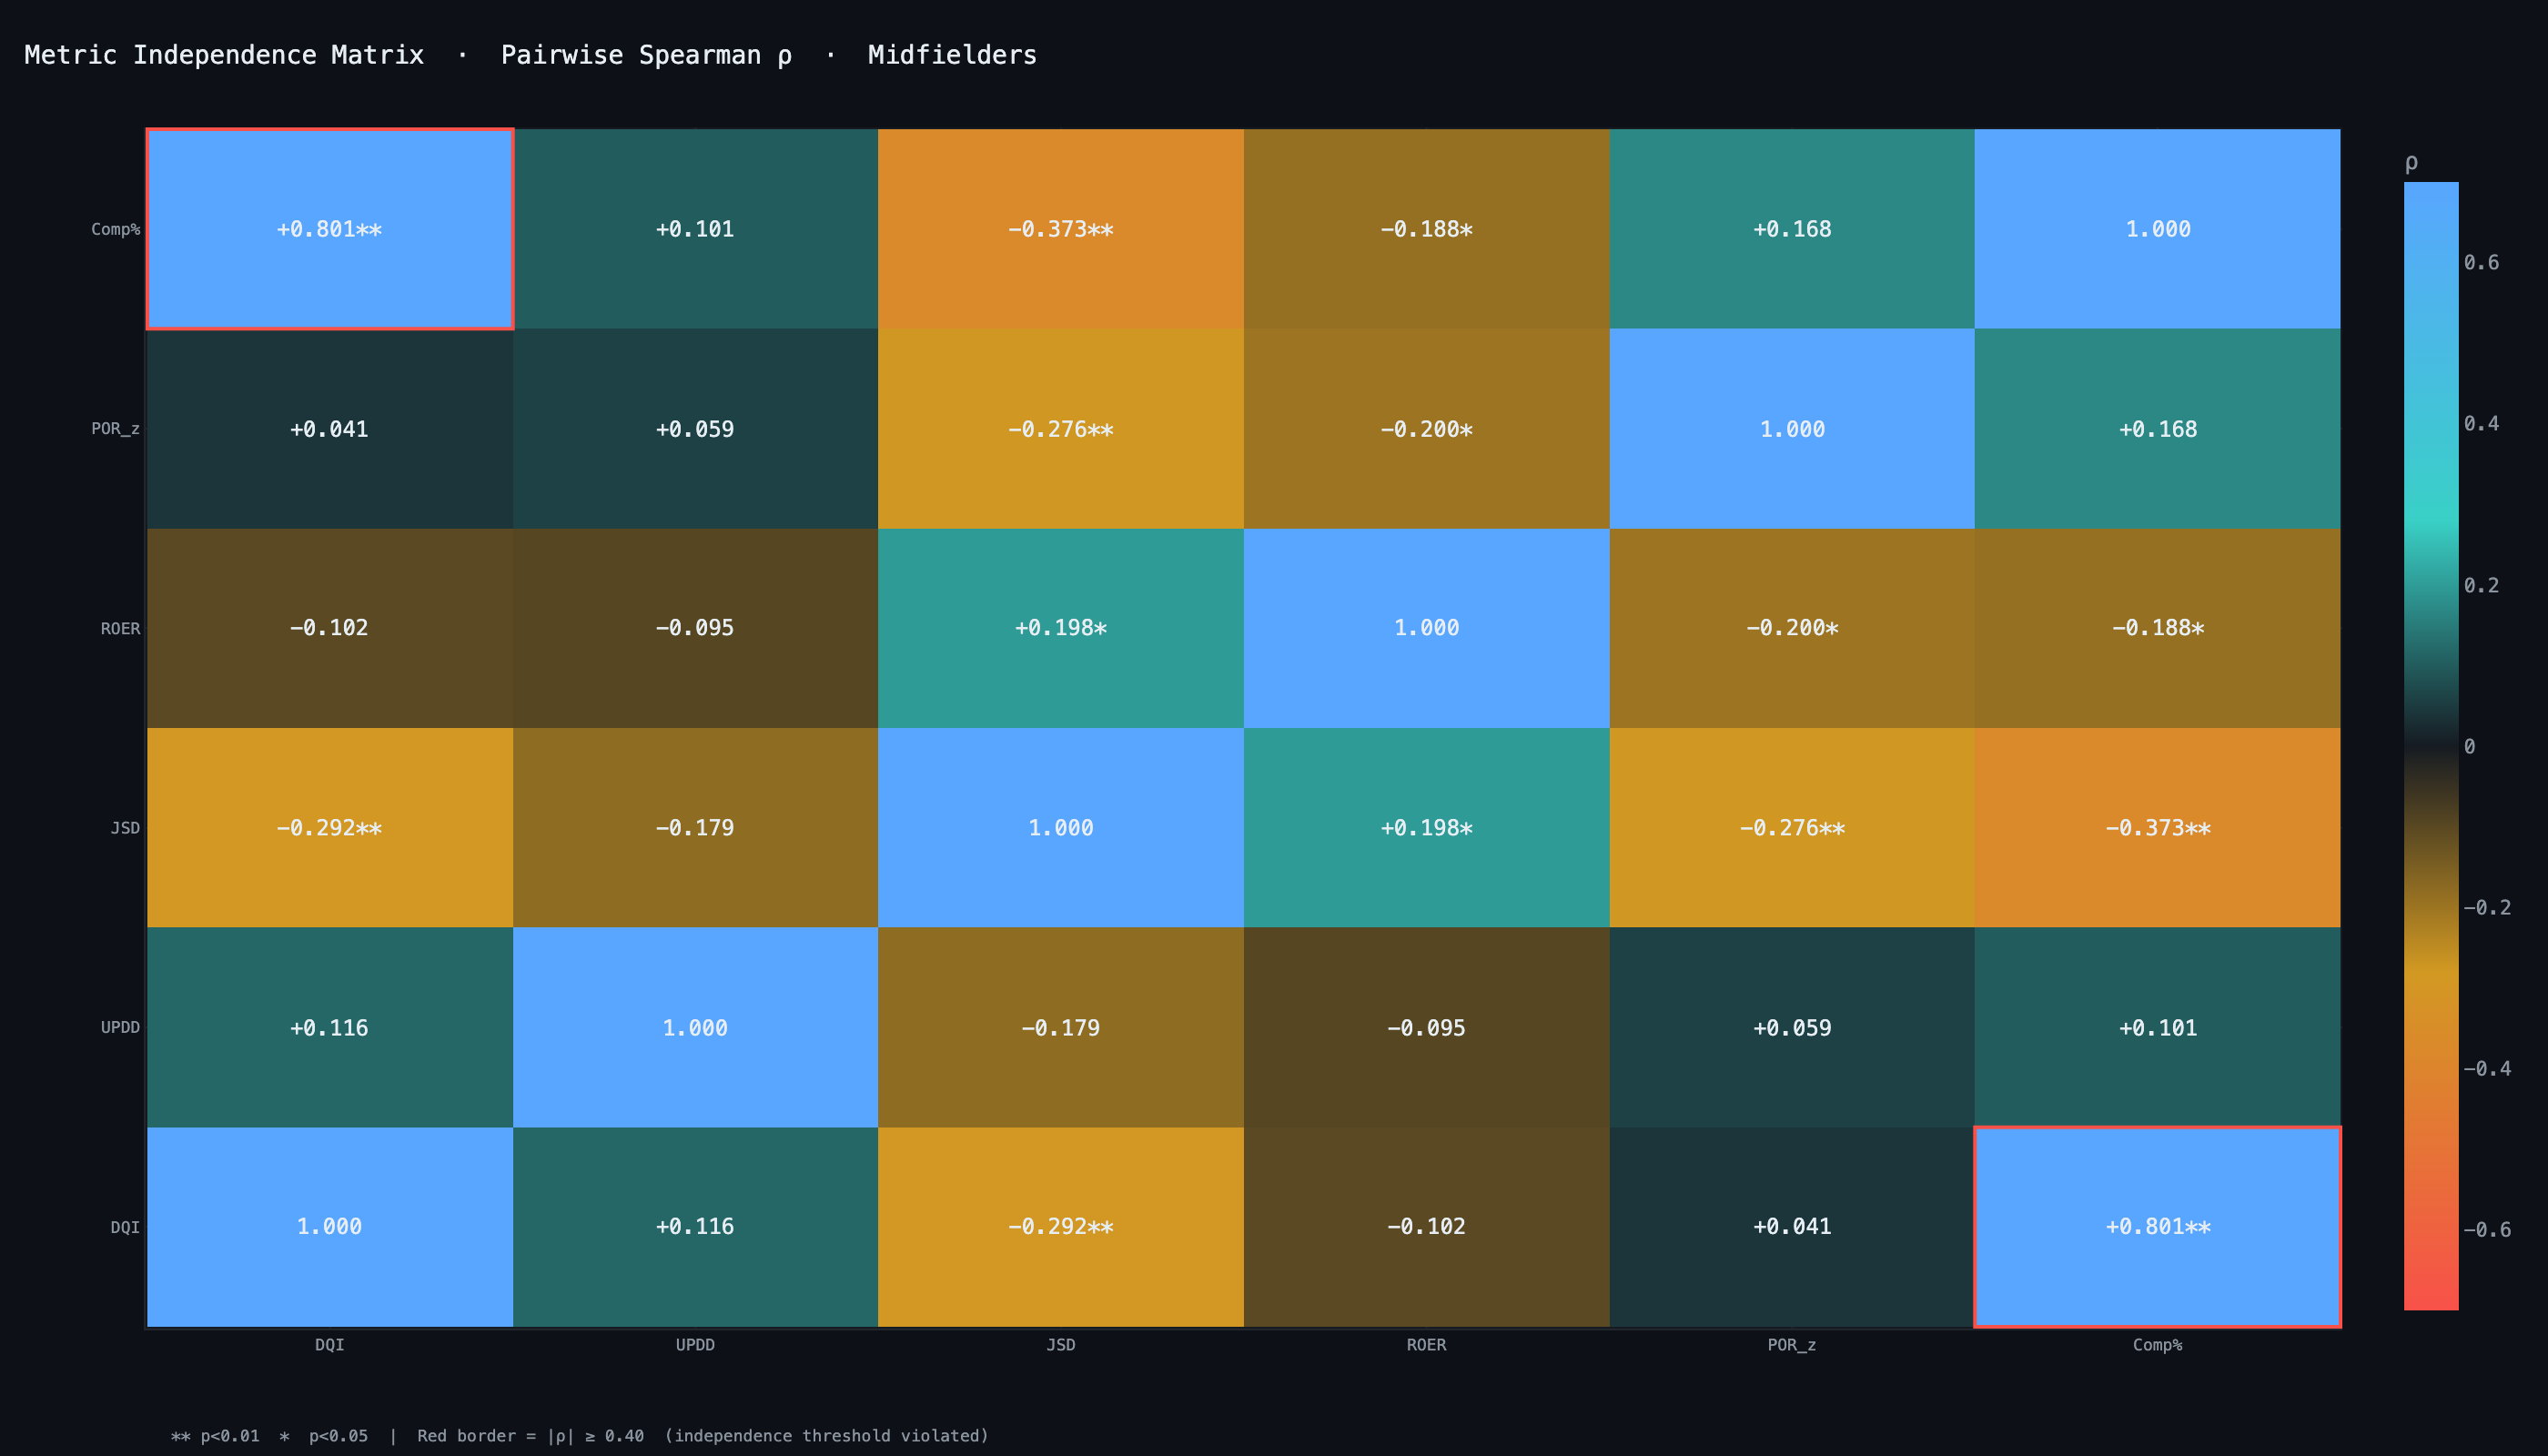
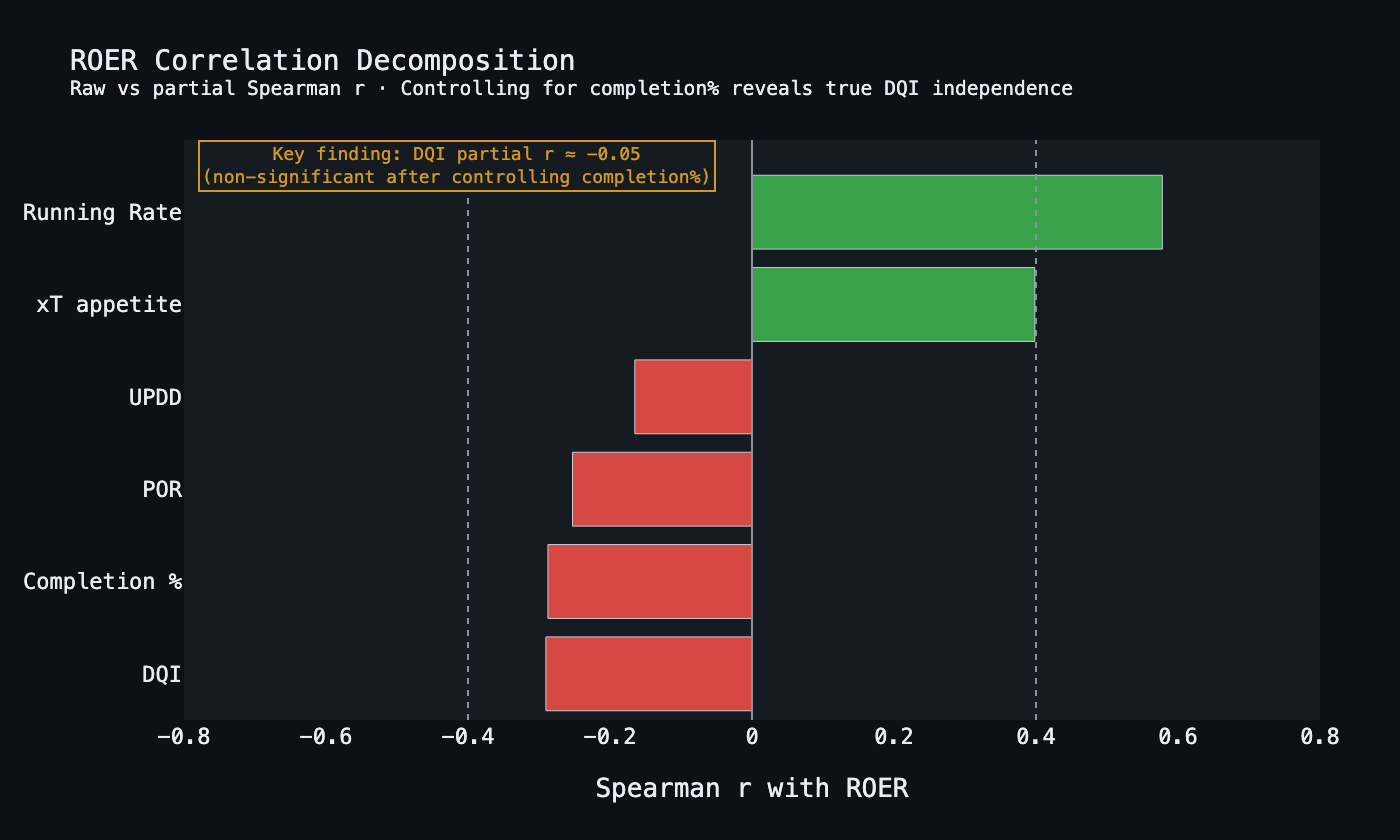
All metrics derived exclusively from Opta Vision feeds — no external data required. Every metric traces to an inspectable pass event. Pull any DQI score and watch the underlying decision. Pairwise Spearman correlations confirm each metric captures a genuinely independent cognitive dimension.

MA36 — Event data

~51K events · ~470K option records. passOption, pressure bands, xPass, xThreat, lineBreakingPass. Primary source for OVS, DQI, UPDD, POR.

MA58 — Off-ball runs

~27K off-ball runs. increasesAvailability, activeRun, relatedEvents linkage. Enables ROER and MA58 quality-stamp validation for 54 players.

MA60 + Shapes + Tracking

Phase-of-play labels for JSD. Shapes for role labelling. Tracking for spatial pressure calibration and pressure delta at origin/receiver.

OVS — Foundation

Option Value Score

$$OVS_i = w_S \cdot xP_i + w_T \cdot xT_i$$
Baseline: w_S = 0.47 (safety), w_T = 0.53 (threat). Additive formulation validated across 470K options. Multiplicative collapses to 12% event survival (xT near zero); additive achieves 94%. Not a preference — a sample-size constraint. LBP boost (+0.15/+0.25) on chosen pass for POR only.
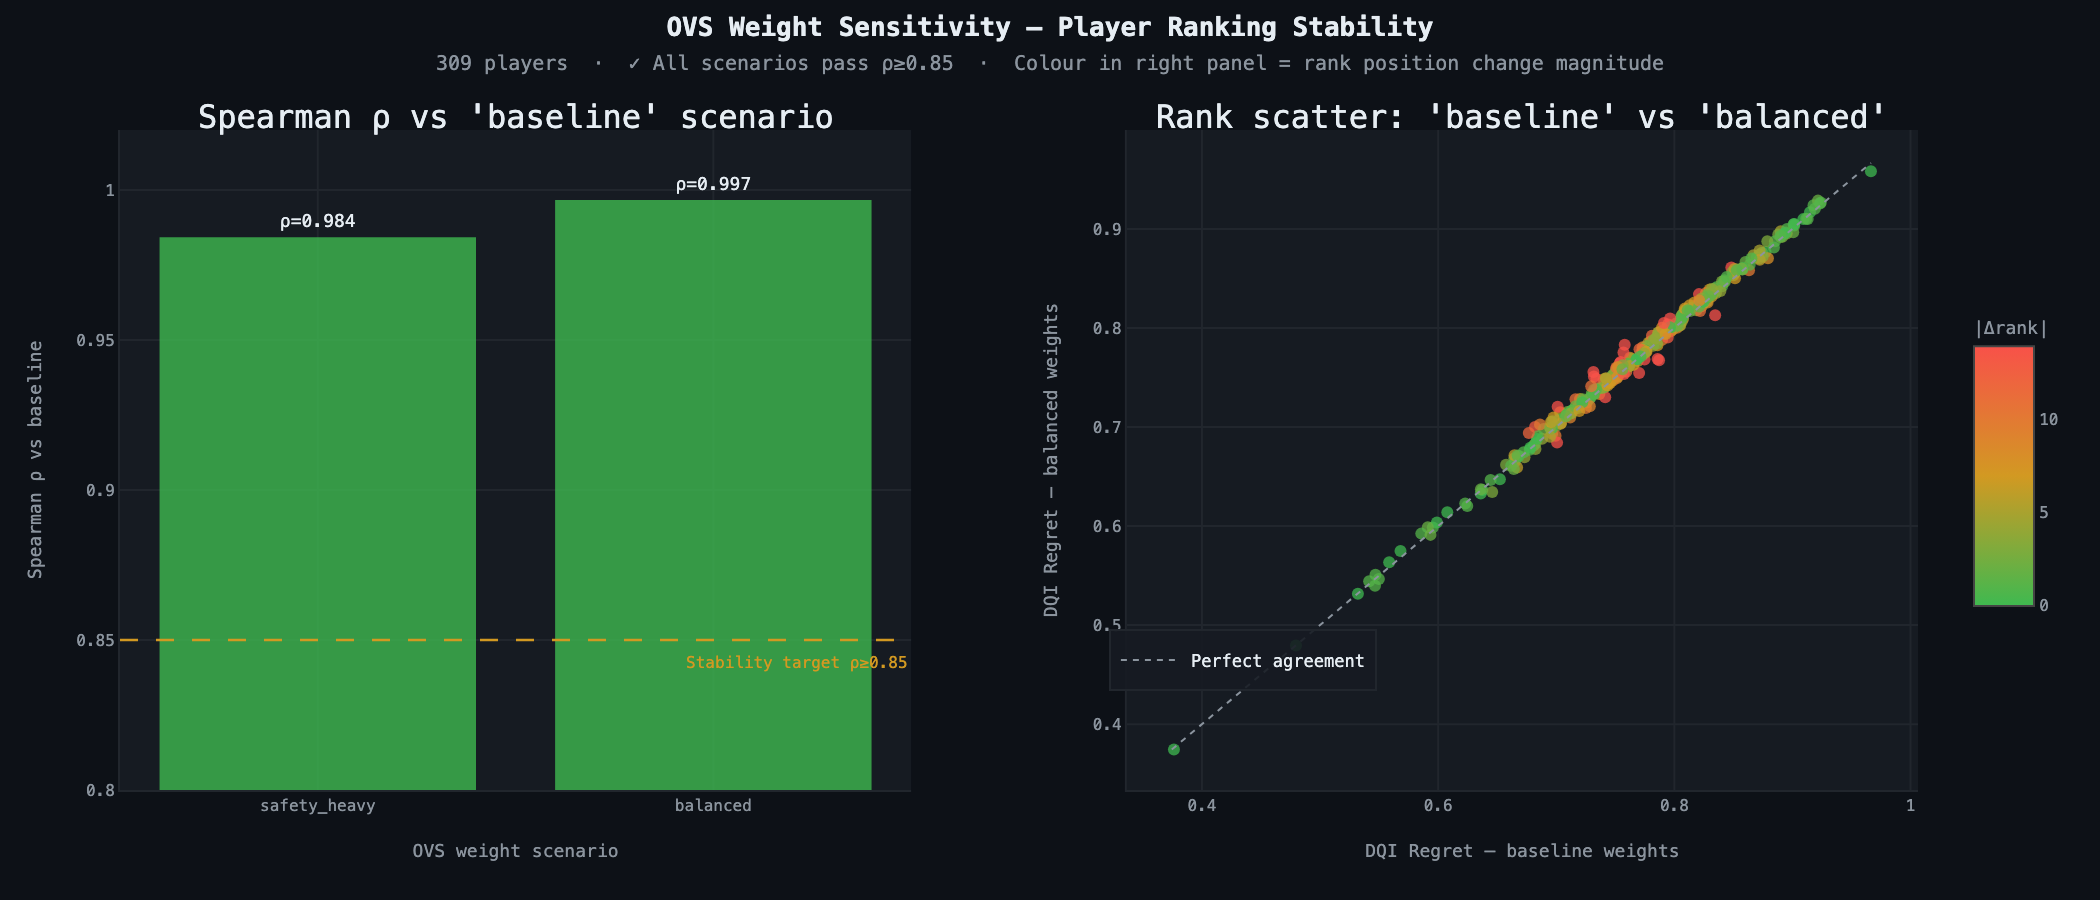
Three weight scenarios: baseline, safety_heavy, balanced. Player ranking Spearman ρ = 0.984–0.997 across all — effectively invariant to weight perturbation.
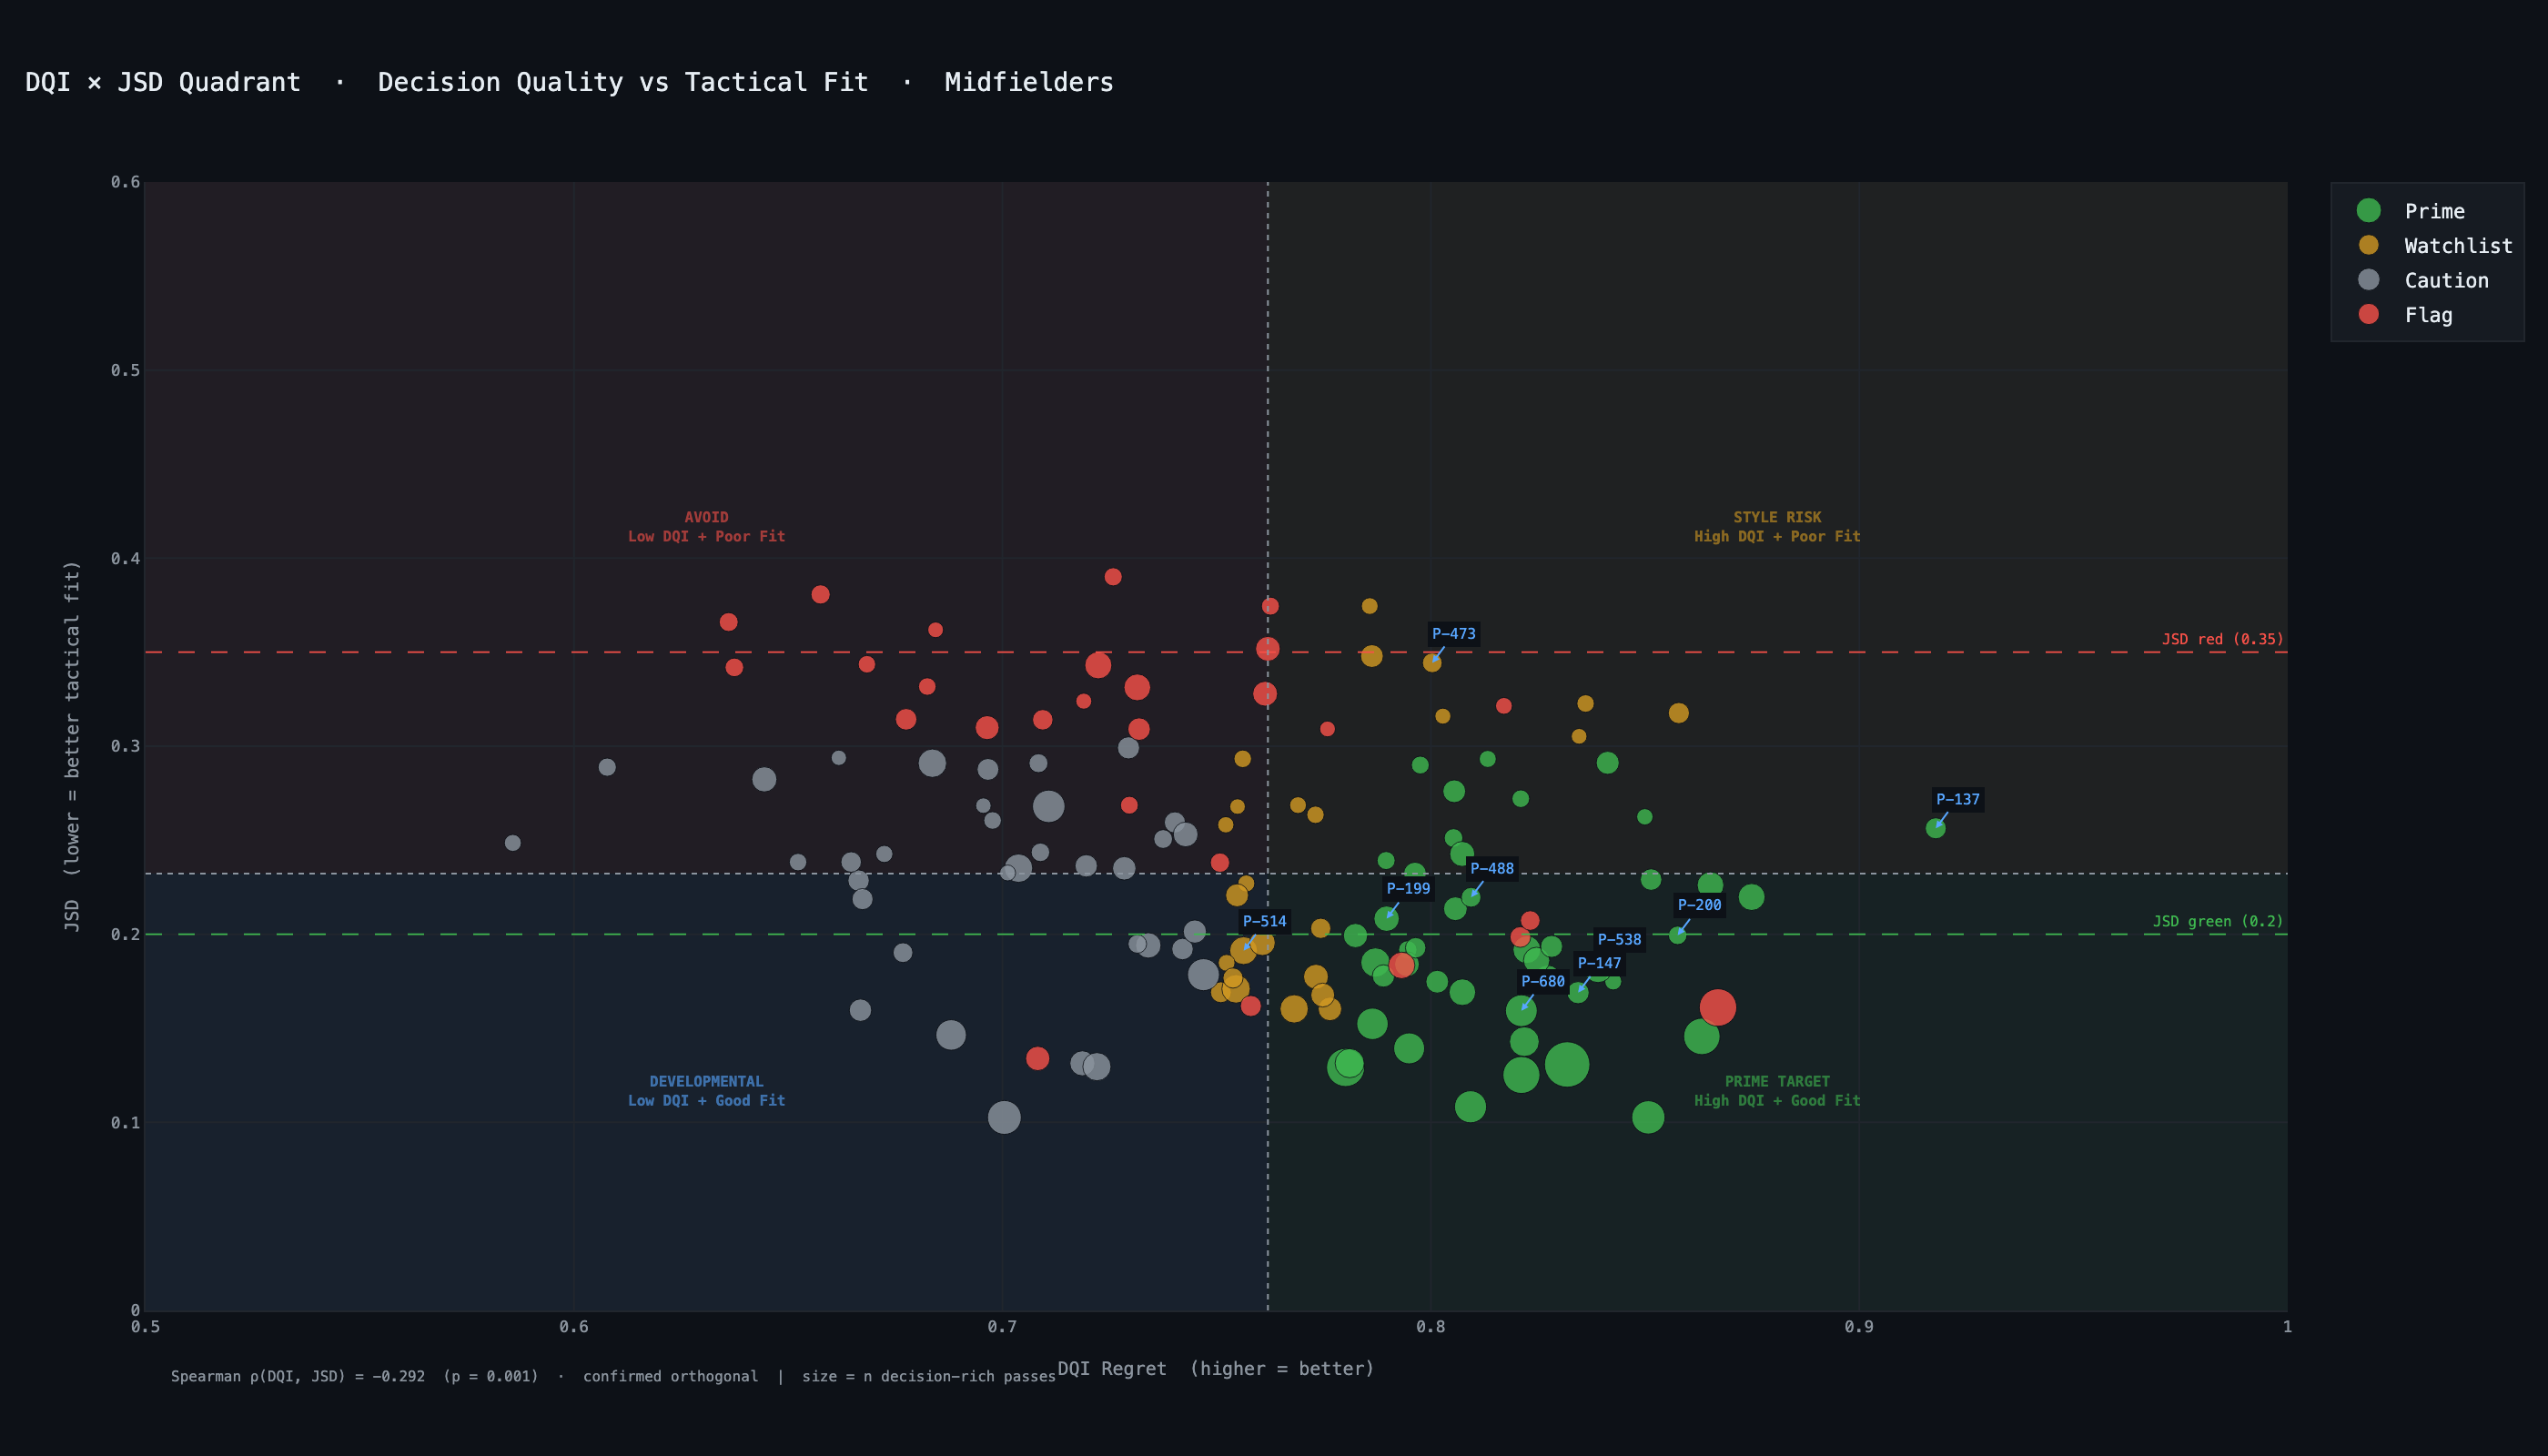
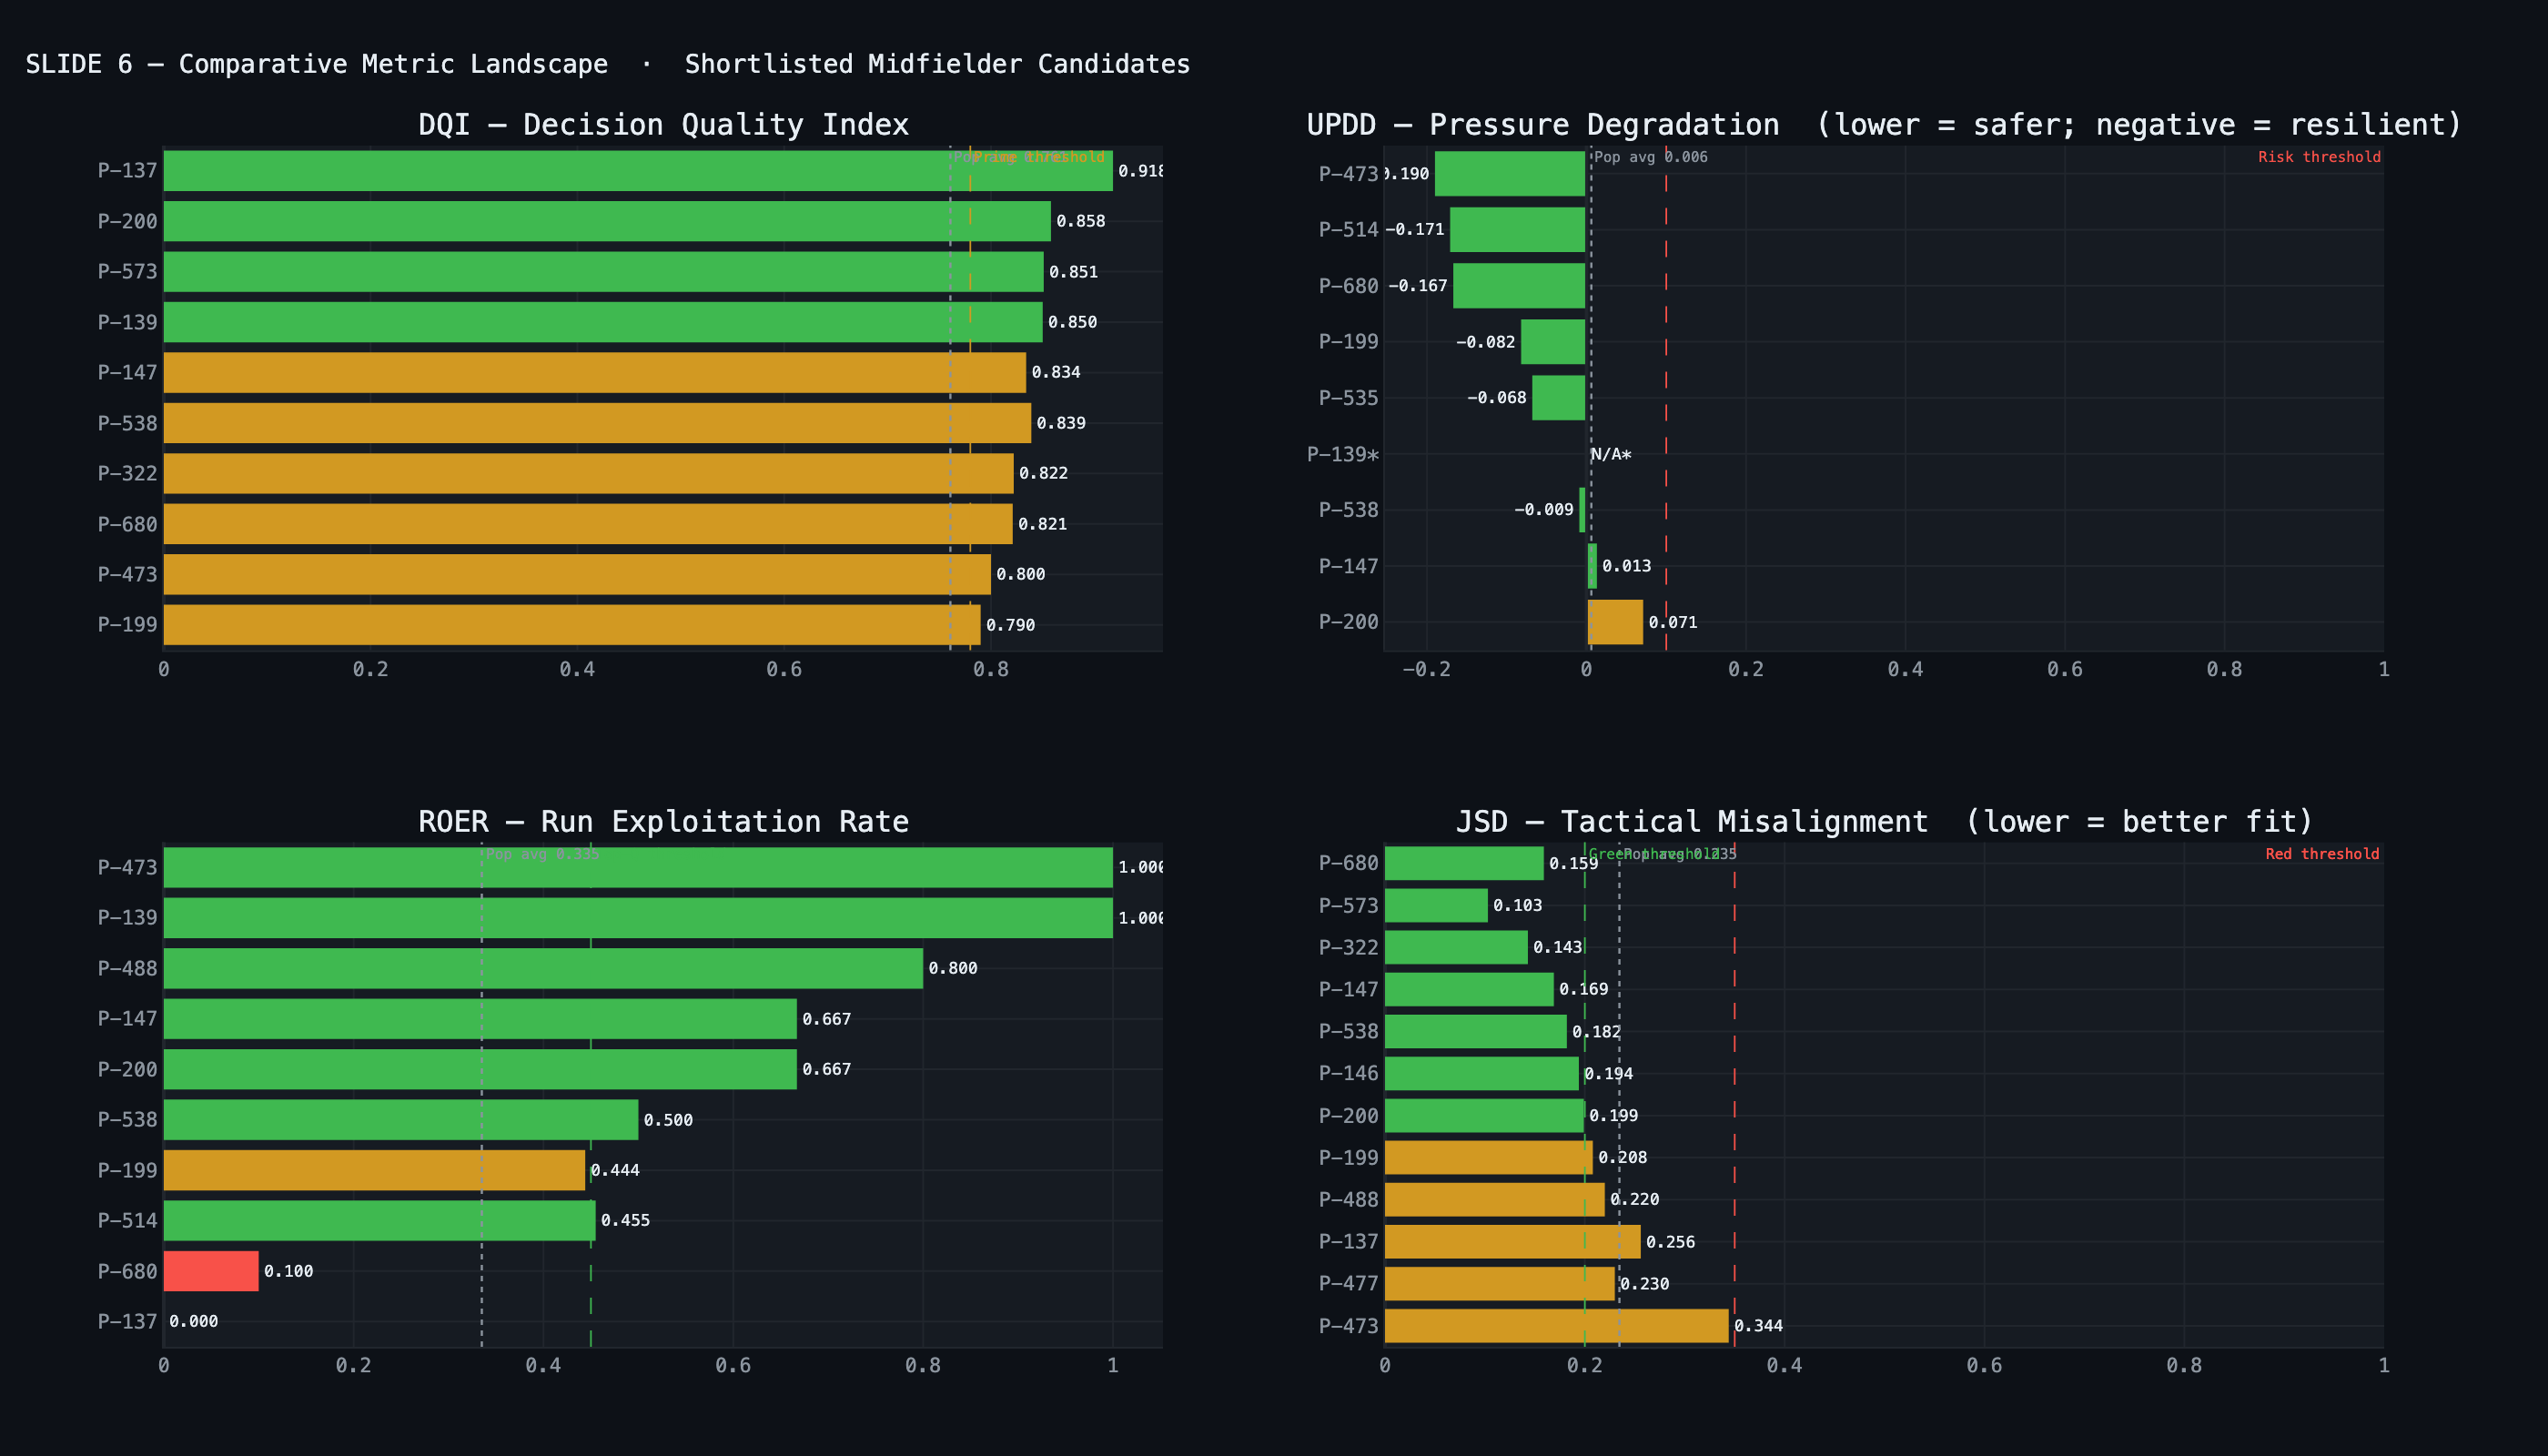
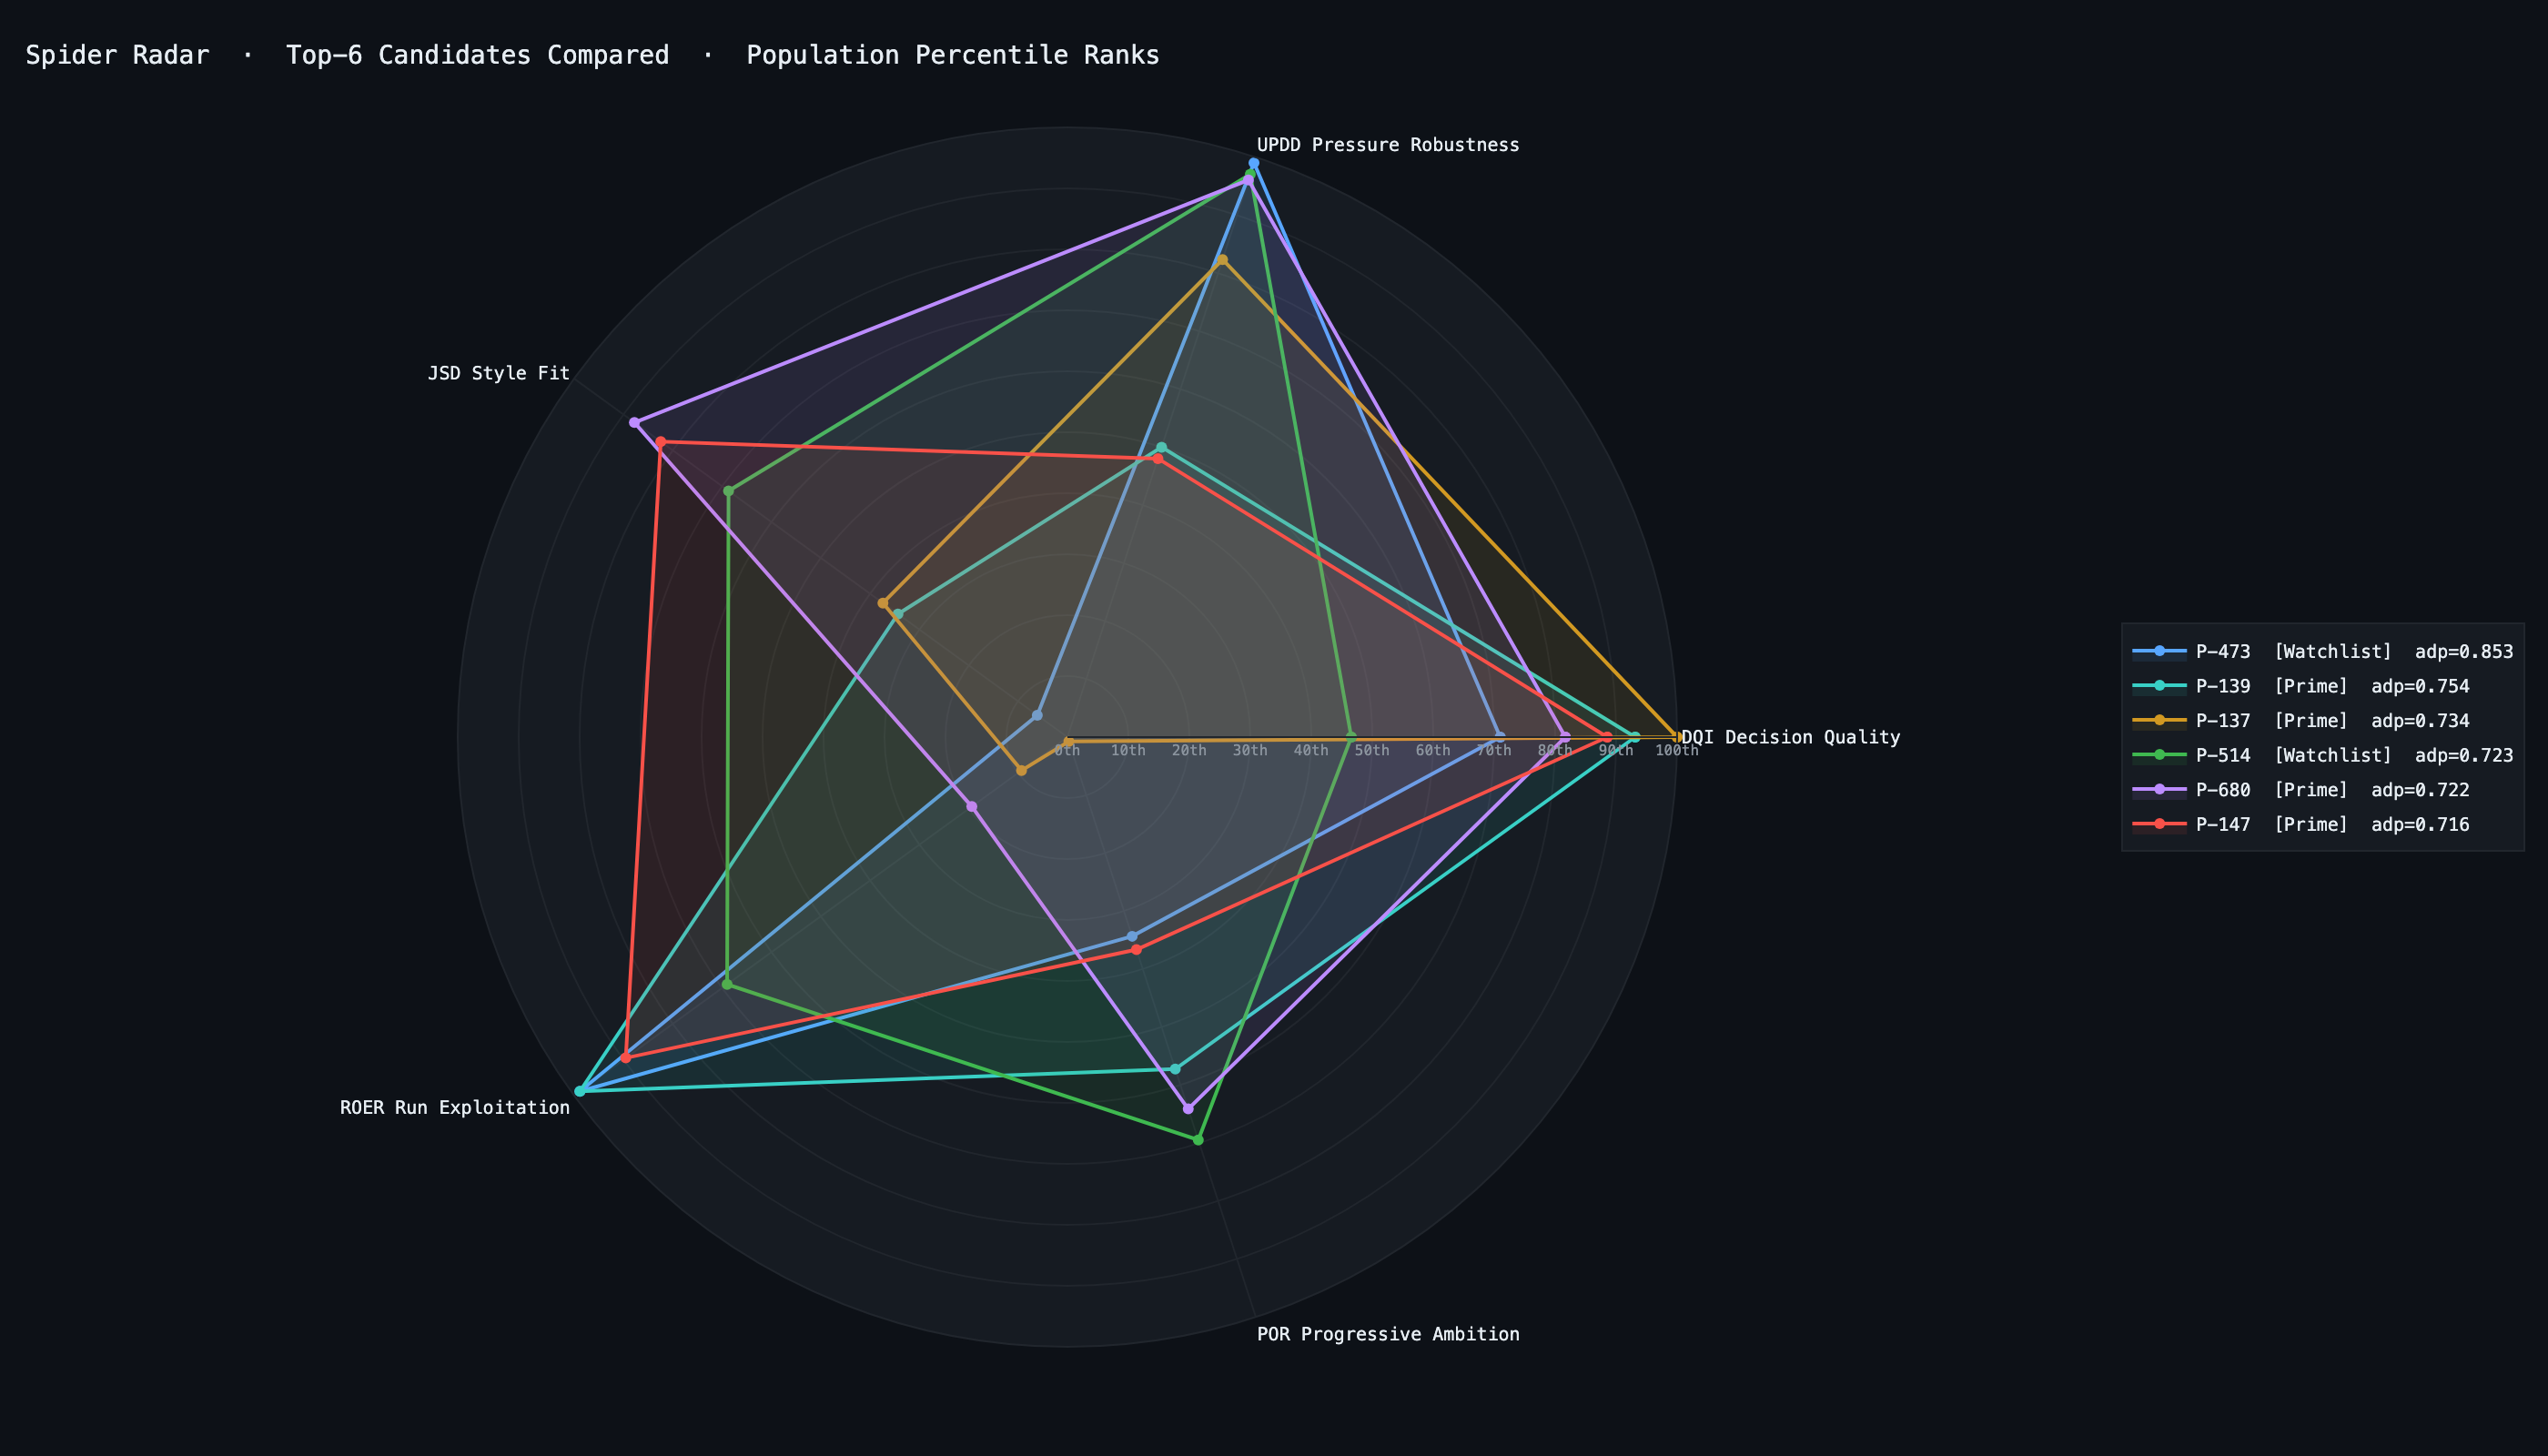
DQI — Primary metric

Decision Quality Index

$$DQI_{regret} = 1 - \frac{OVS_{best} - OVS_{chosen}}{OVS_{best} - OVS_{min}}$$
Decision-rich events only: ≥2 options above OVS_COMPETITOR_TAU (removes reflex decisions). Range [0,1]; 1.0 = chose optimal. Softmax temperature T = 0.10.
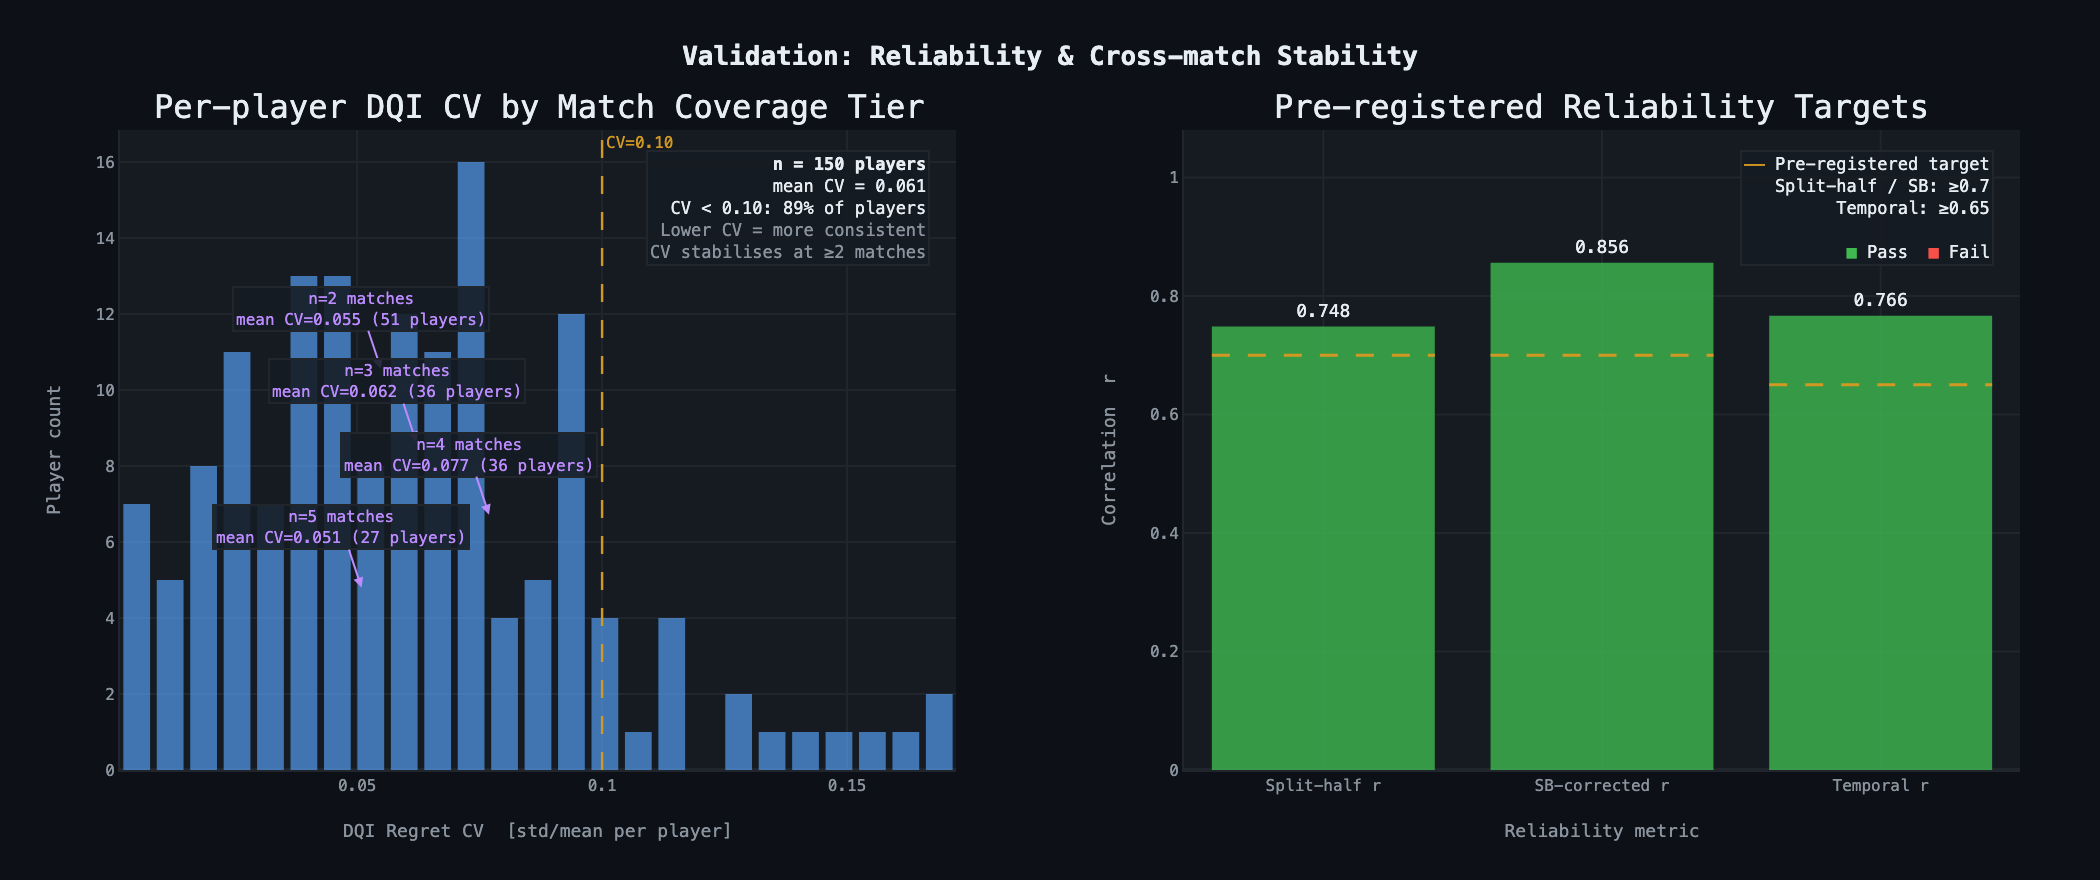
Split-half r = 0.748 / SB = 0.856 · Temporal r = 0.766 · External criterion: ρ(DQI, turnover_high_pressure) = −0.642, r_rb = −0.858. Dose-response Q1→Q4: 33.8% → 26.0% → 20.9% → 17.5%.
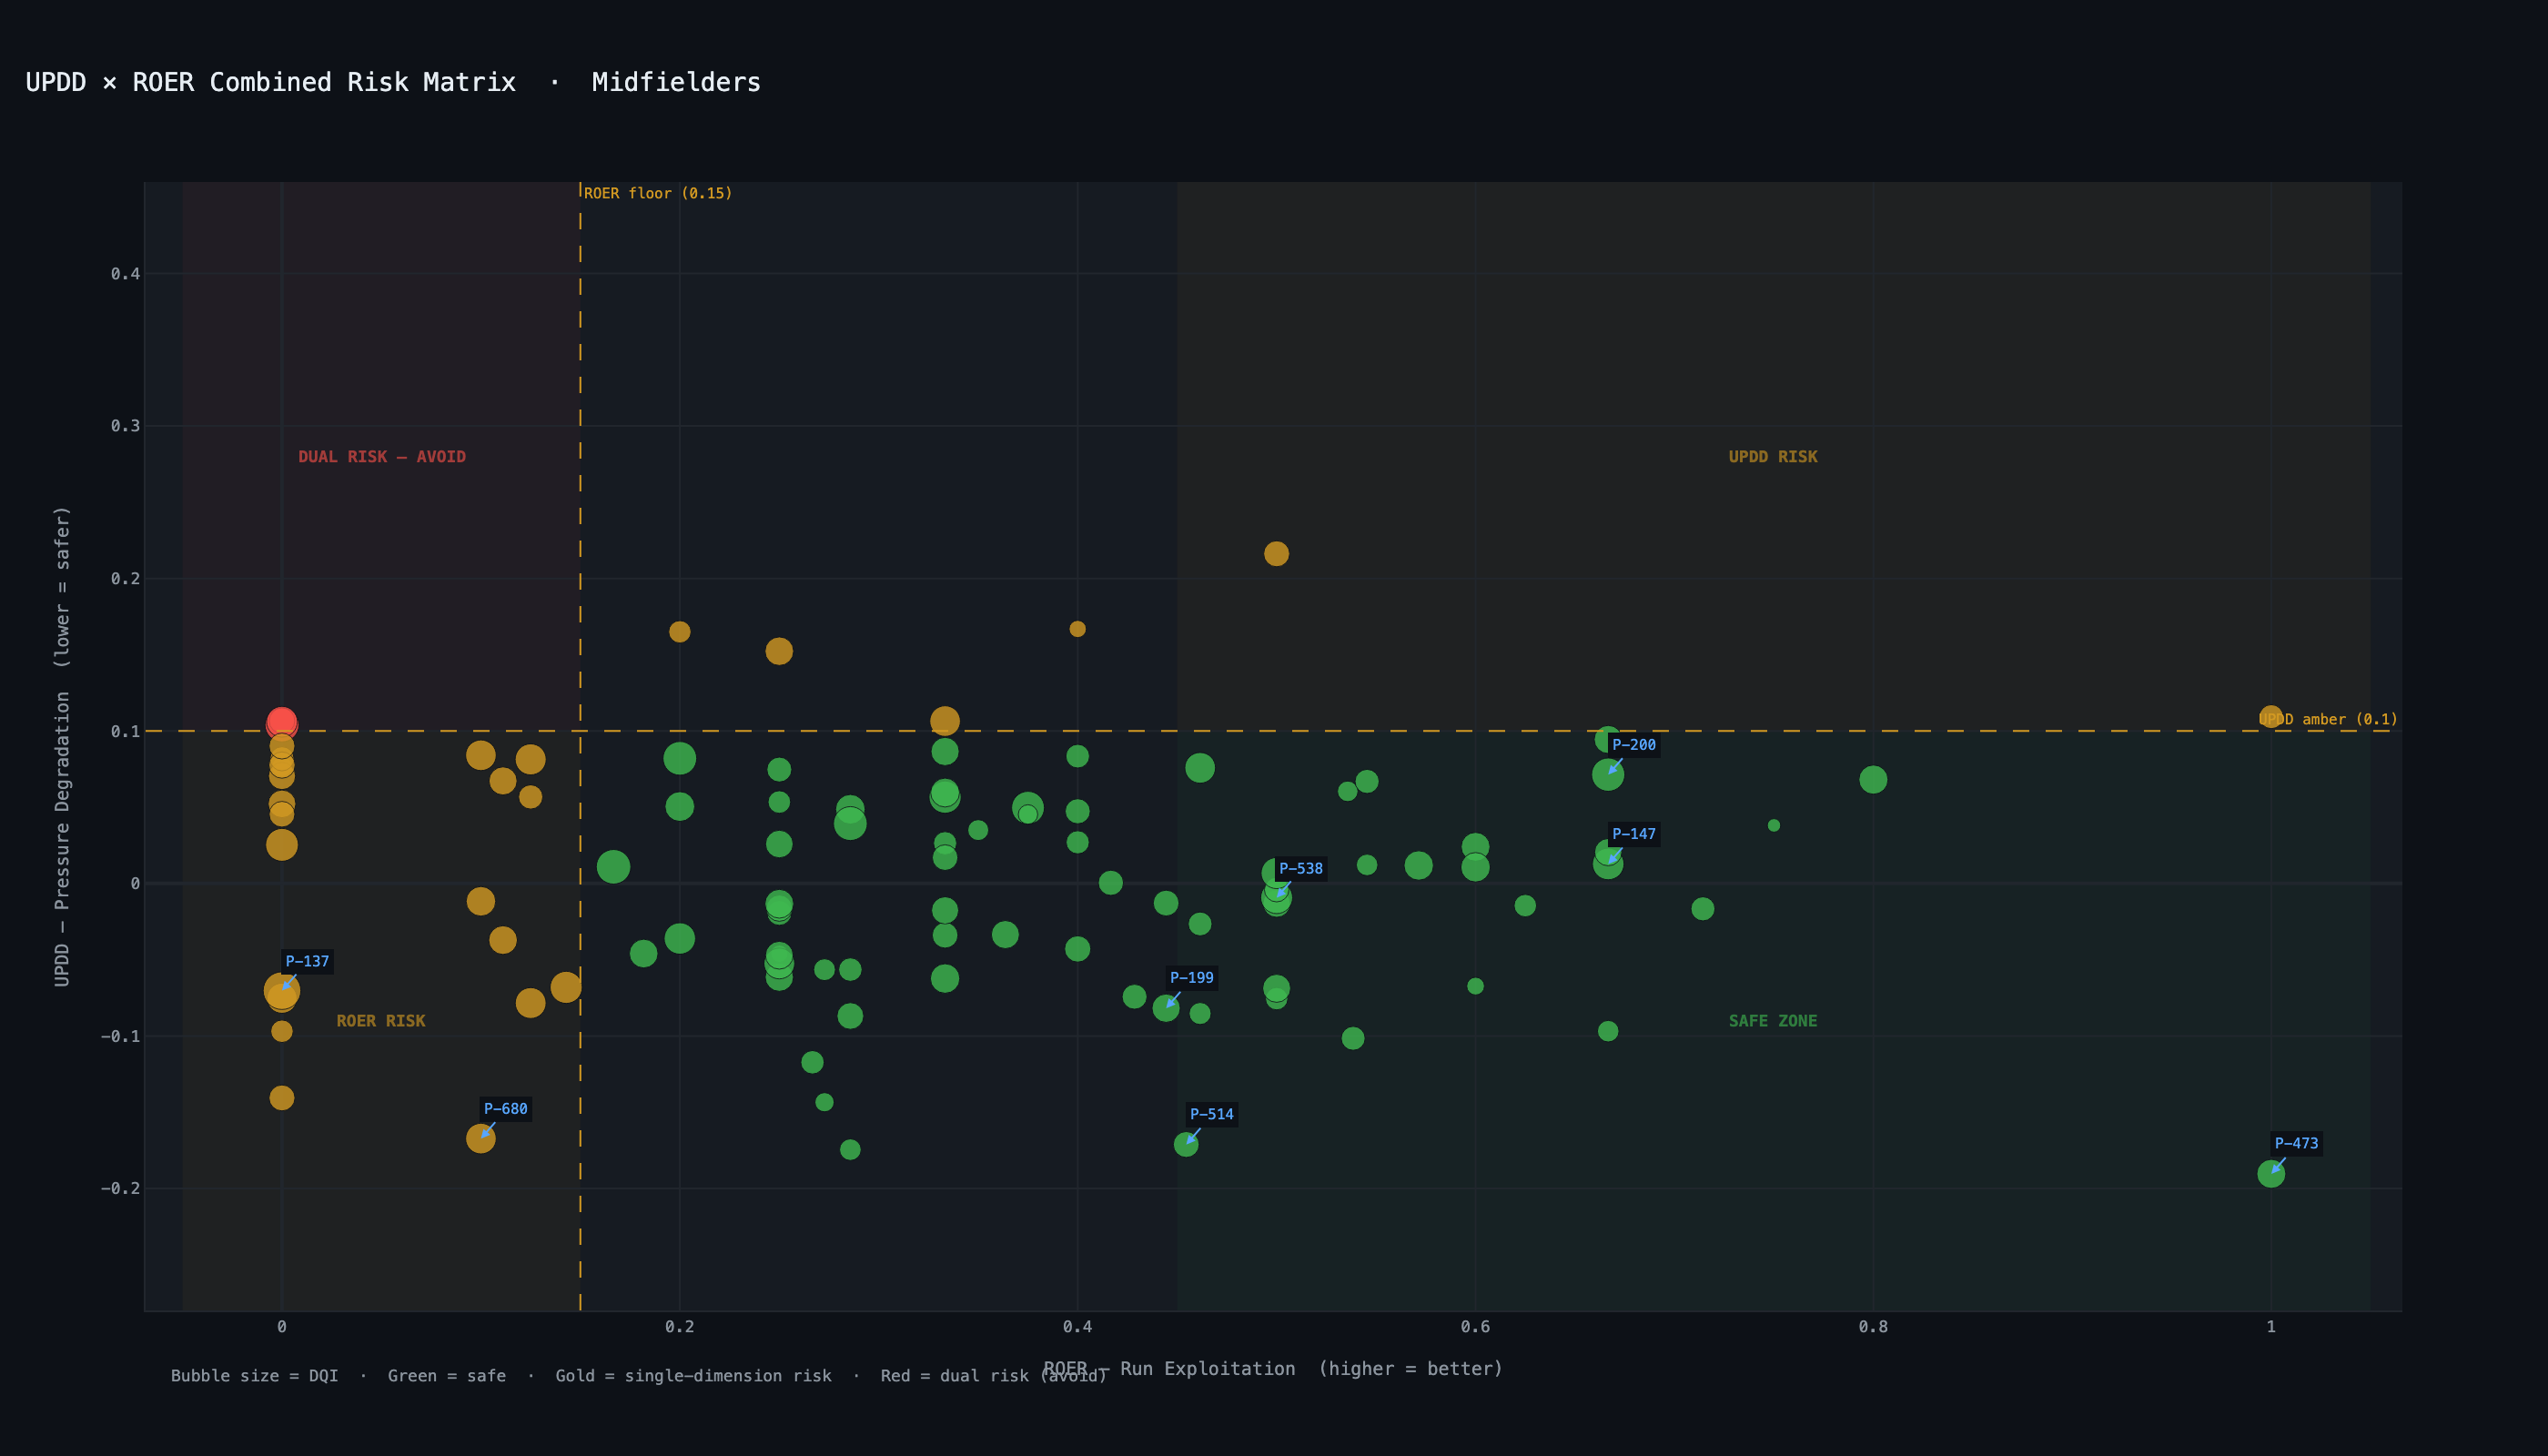
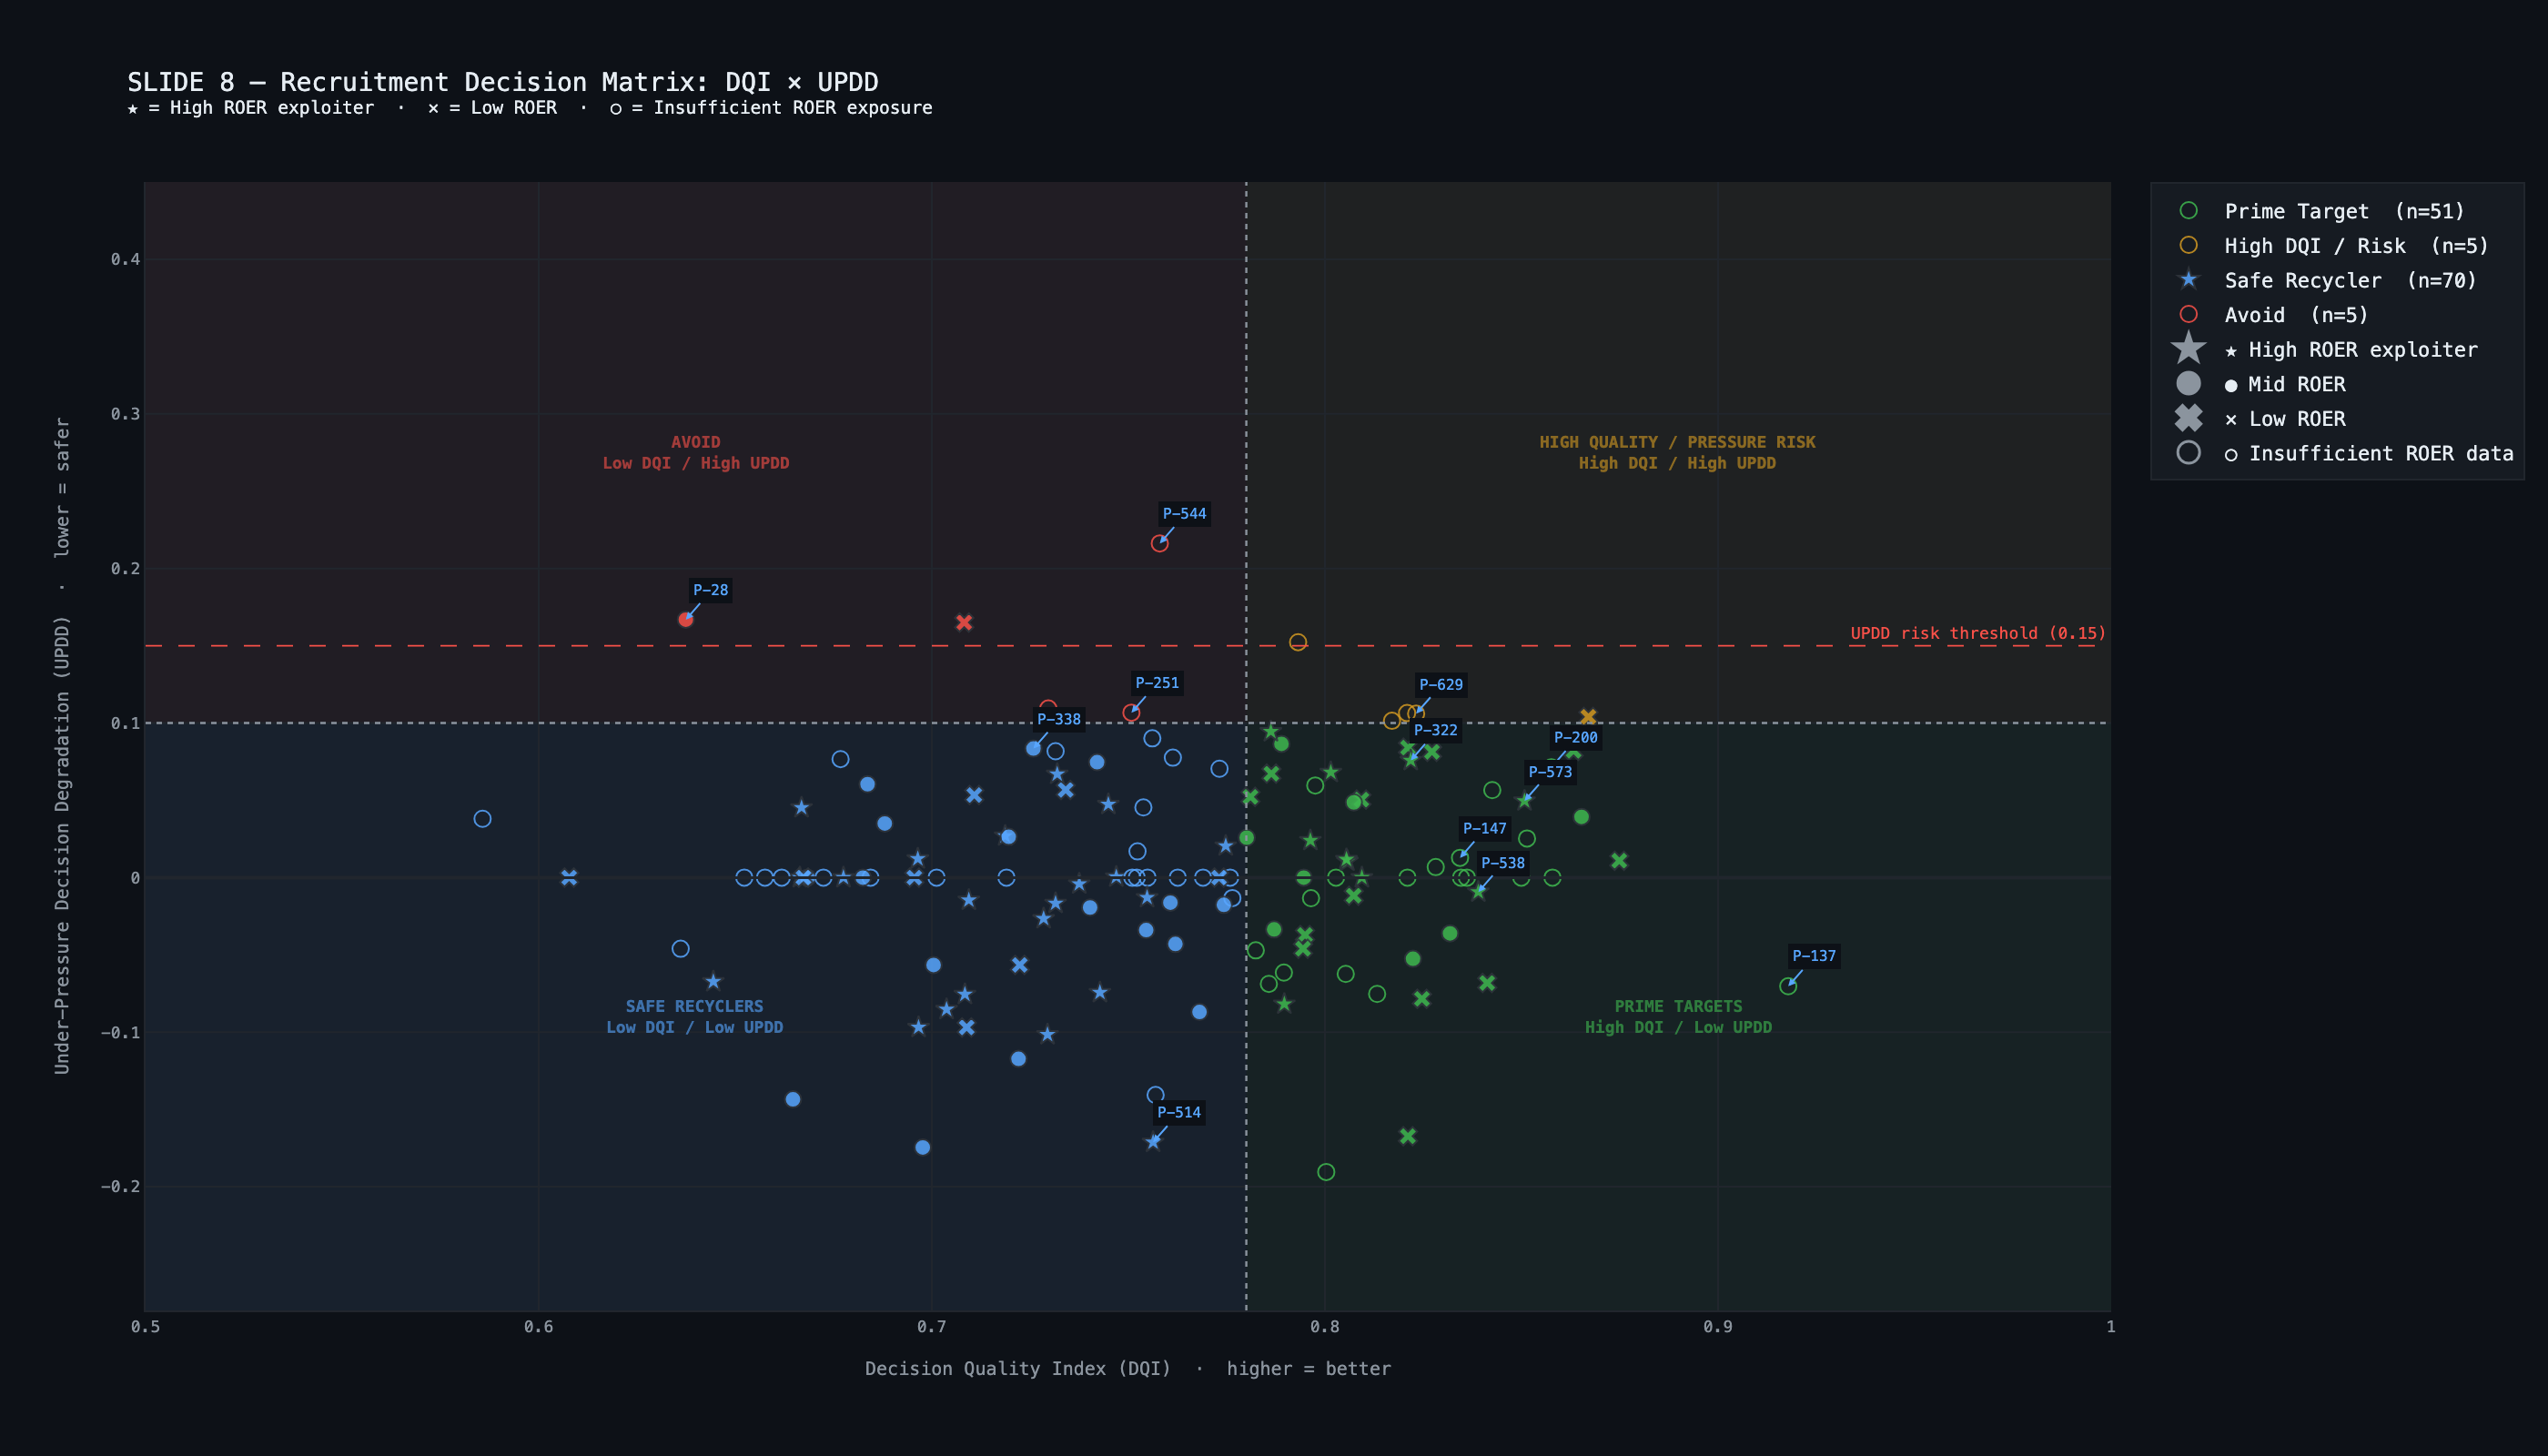
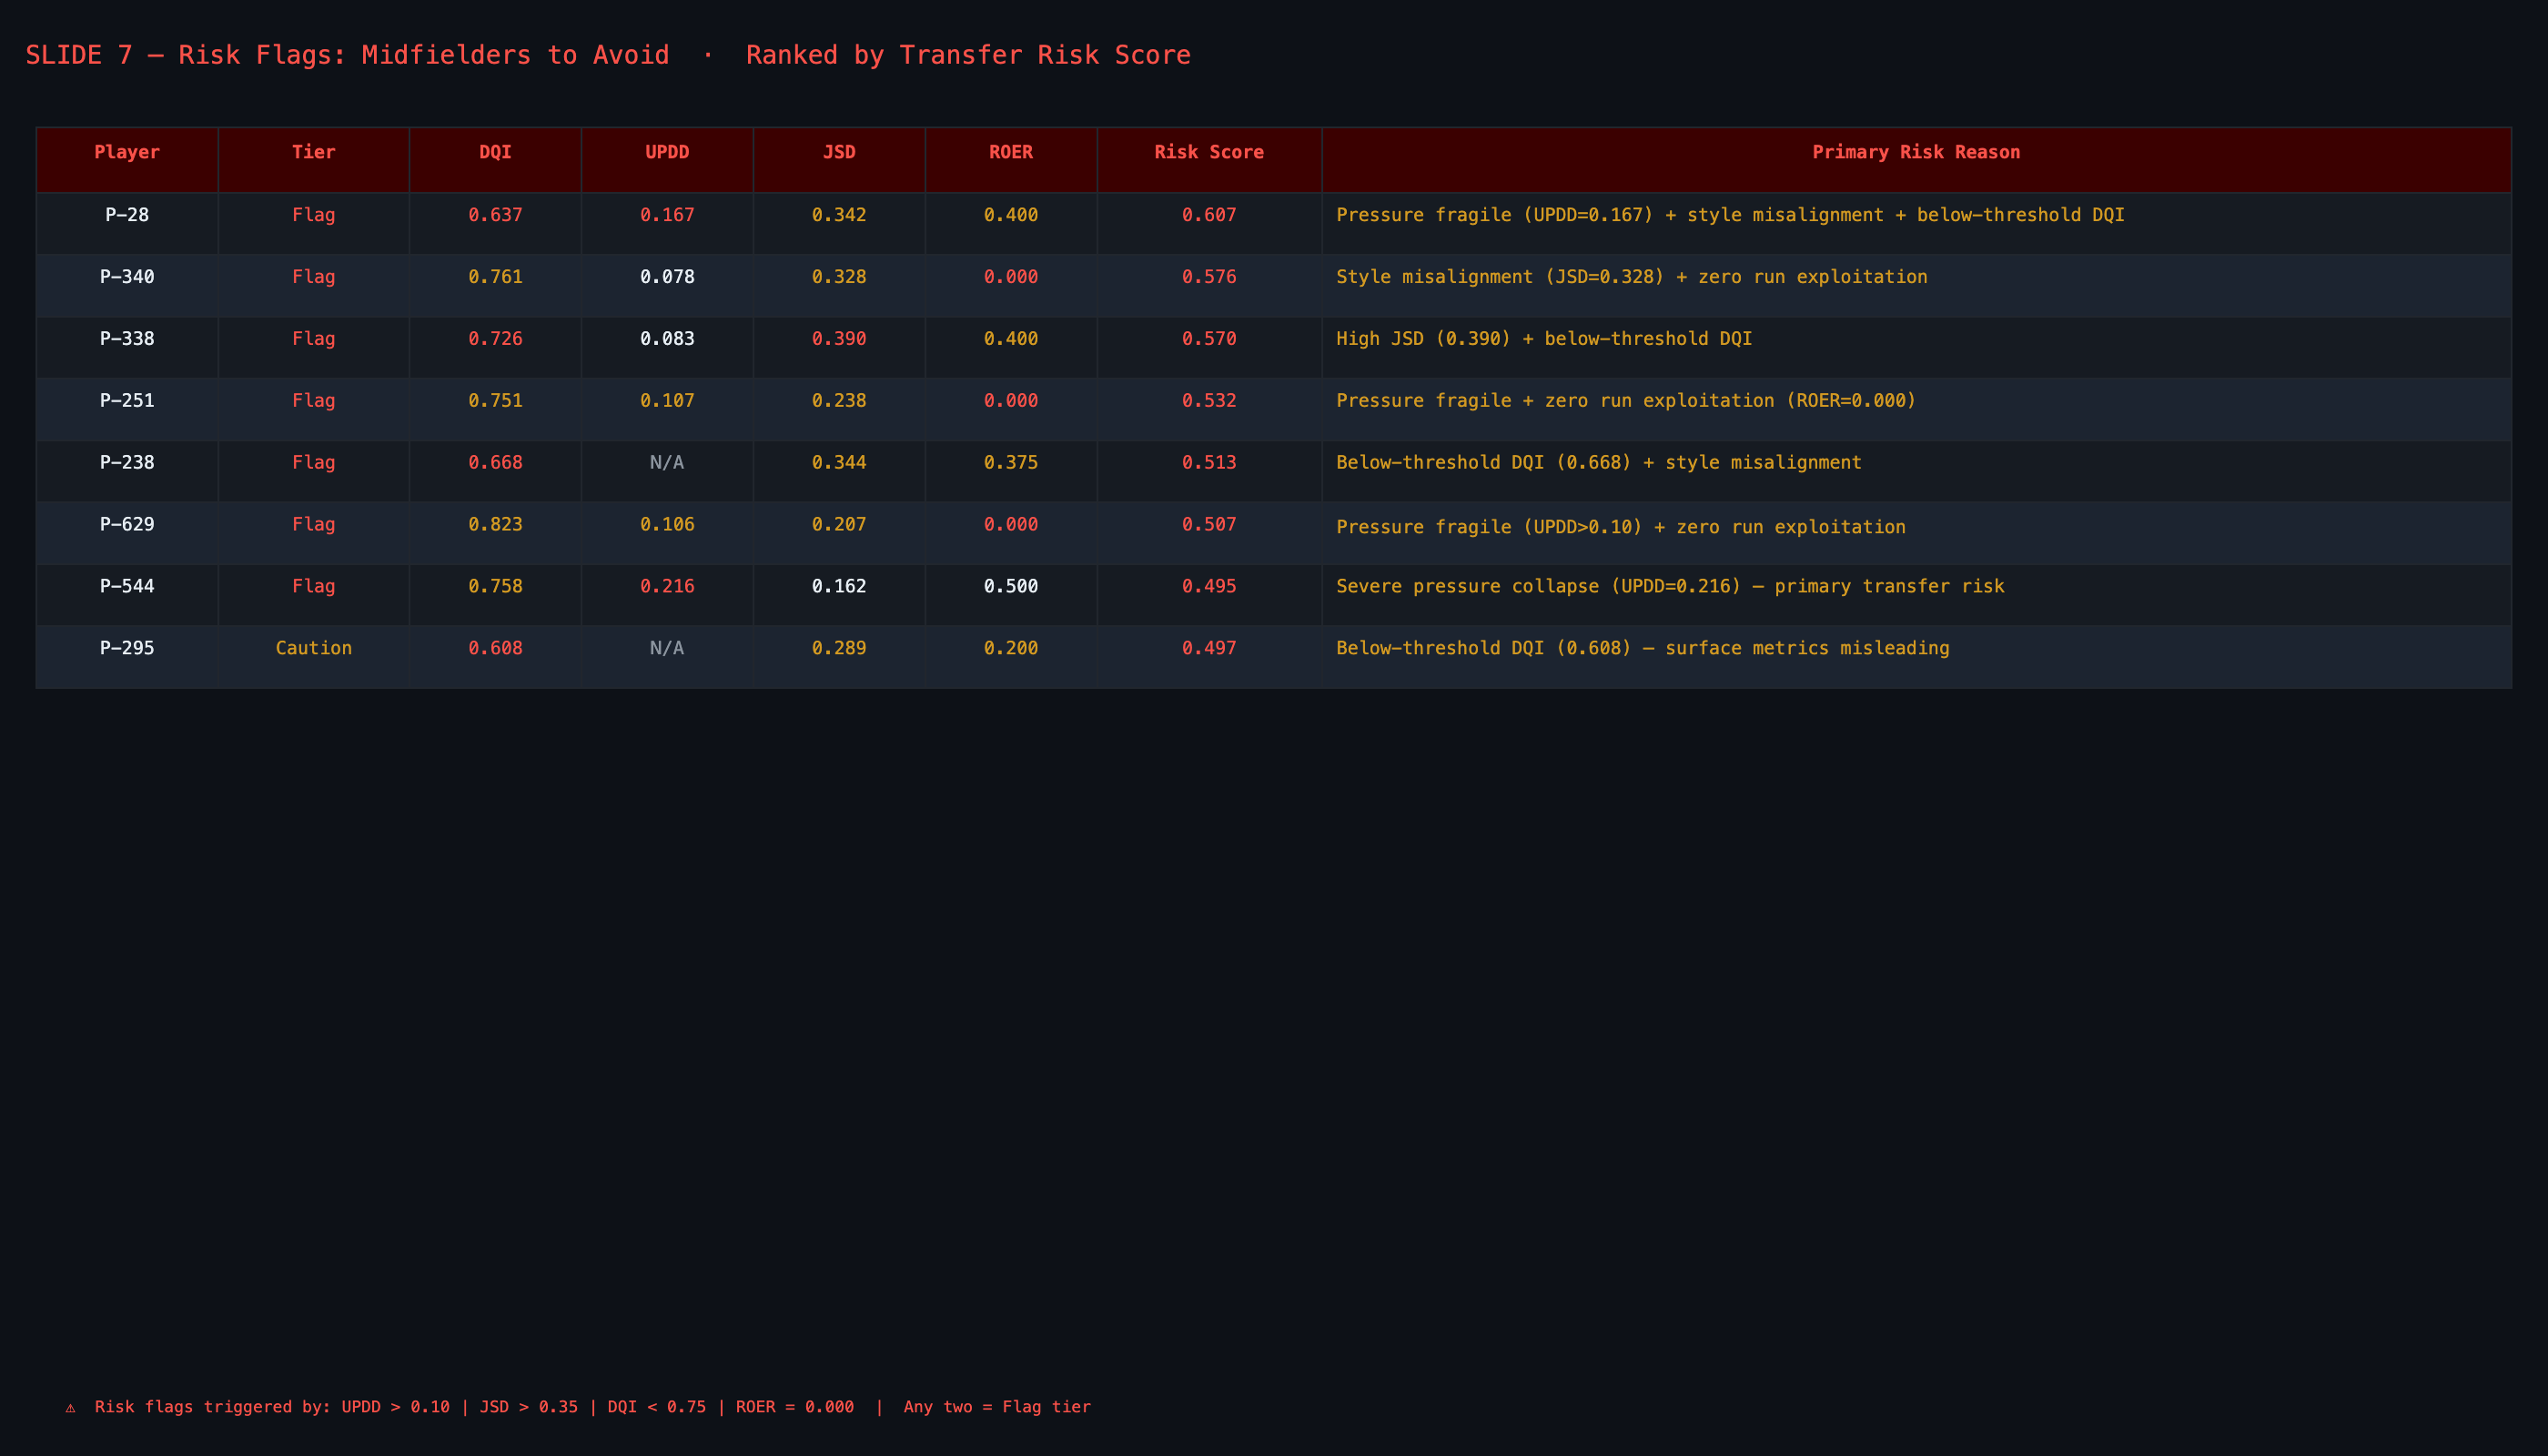
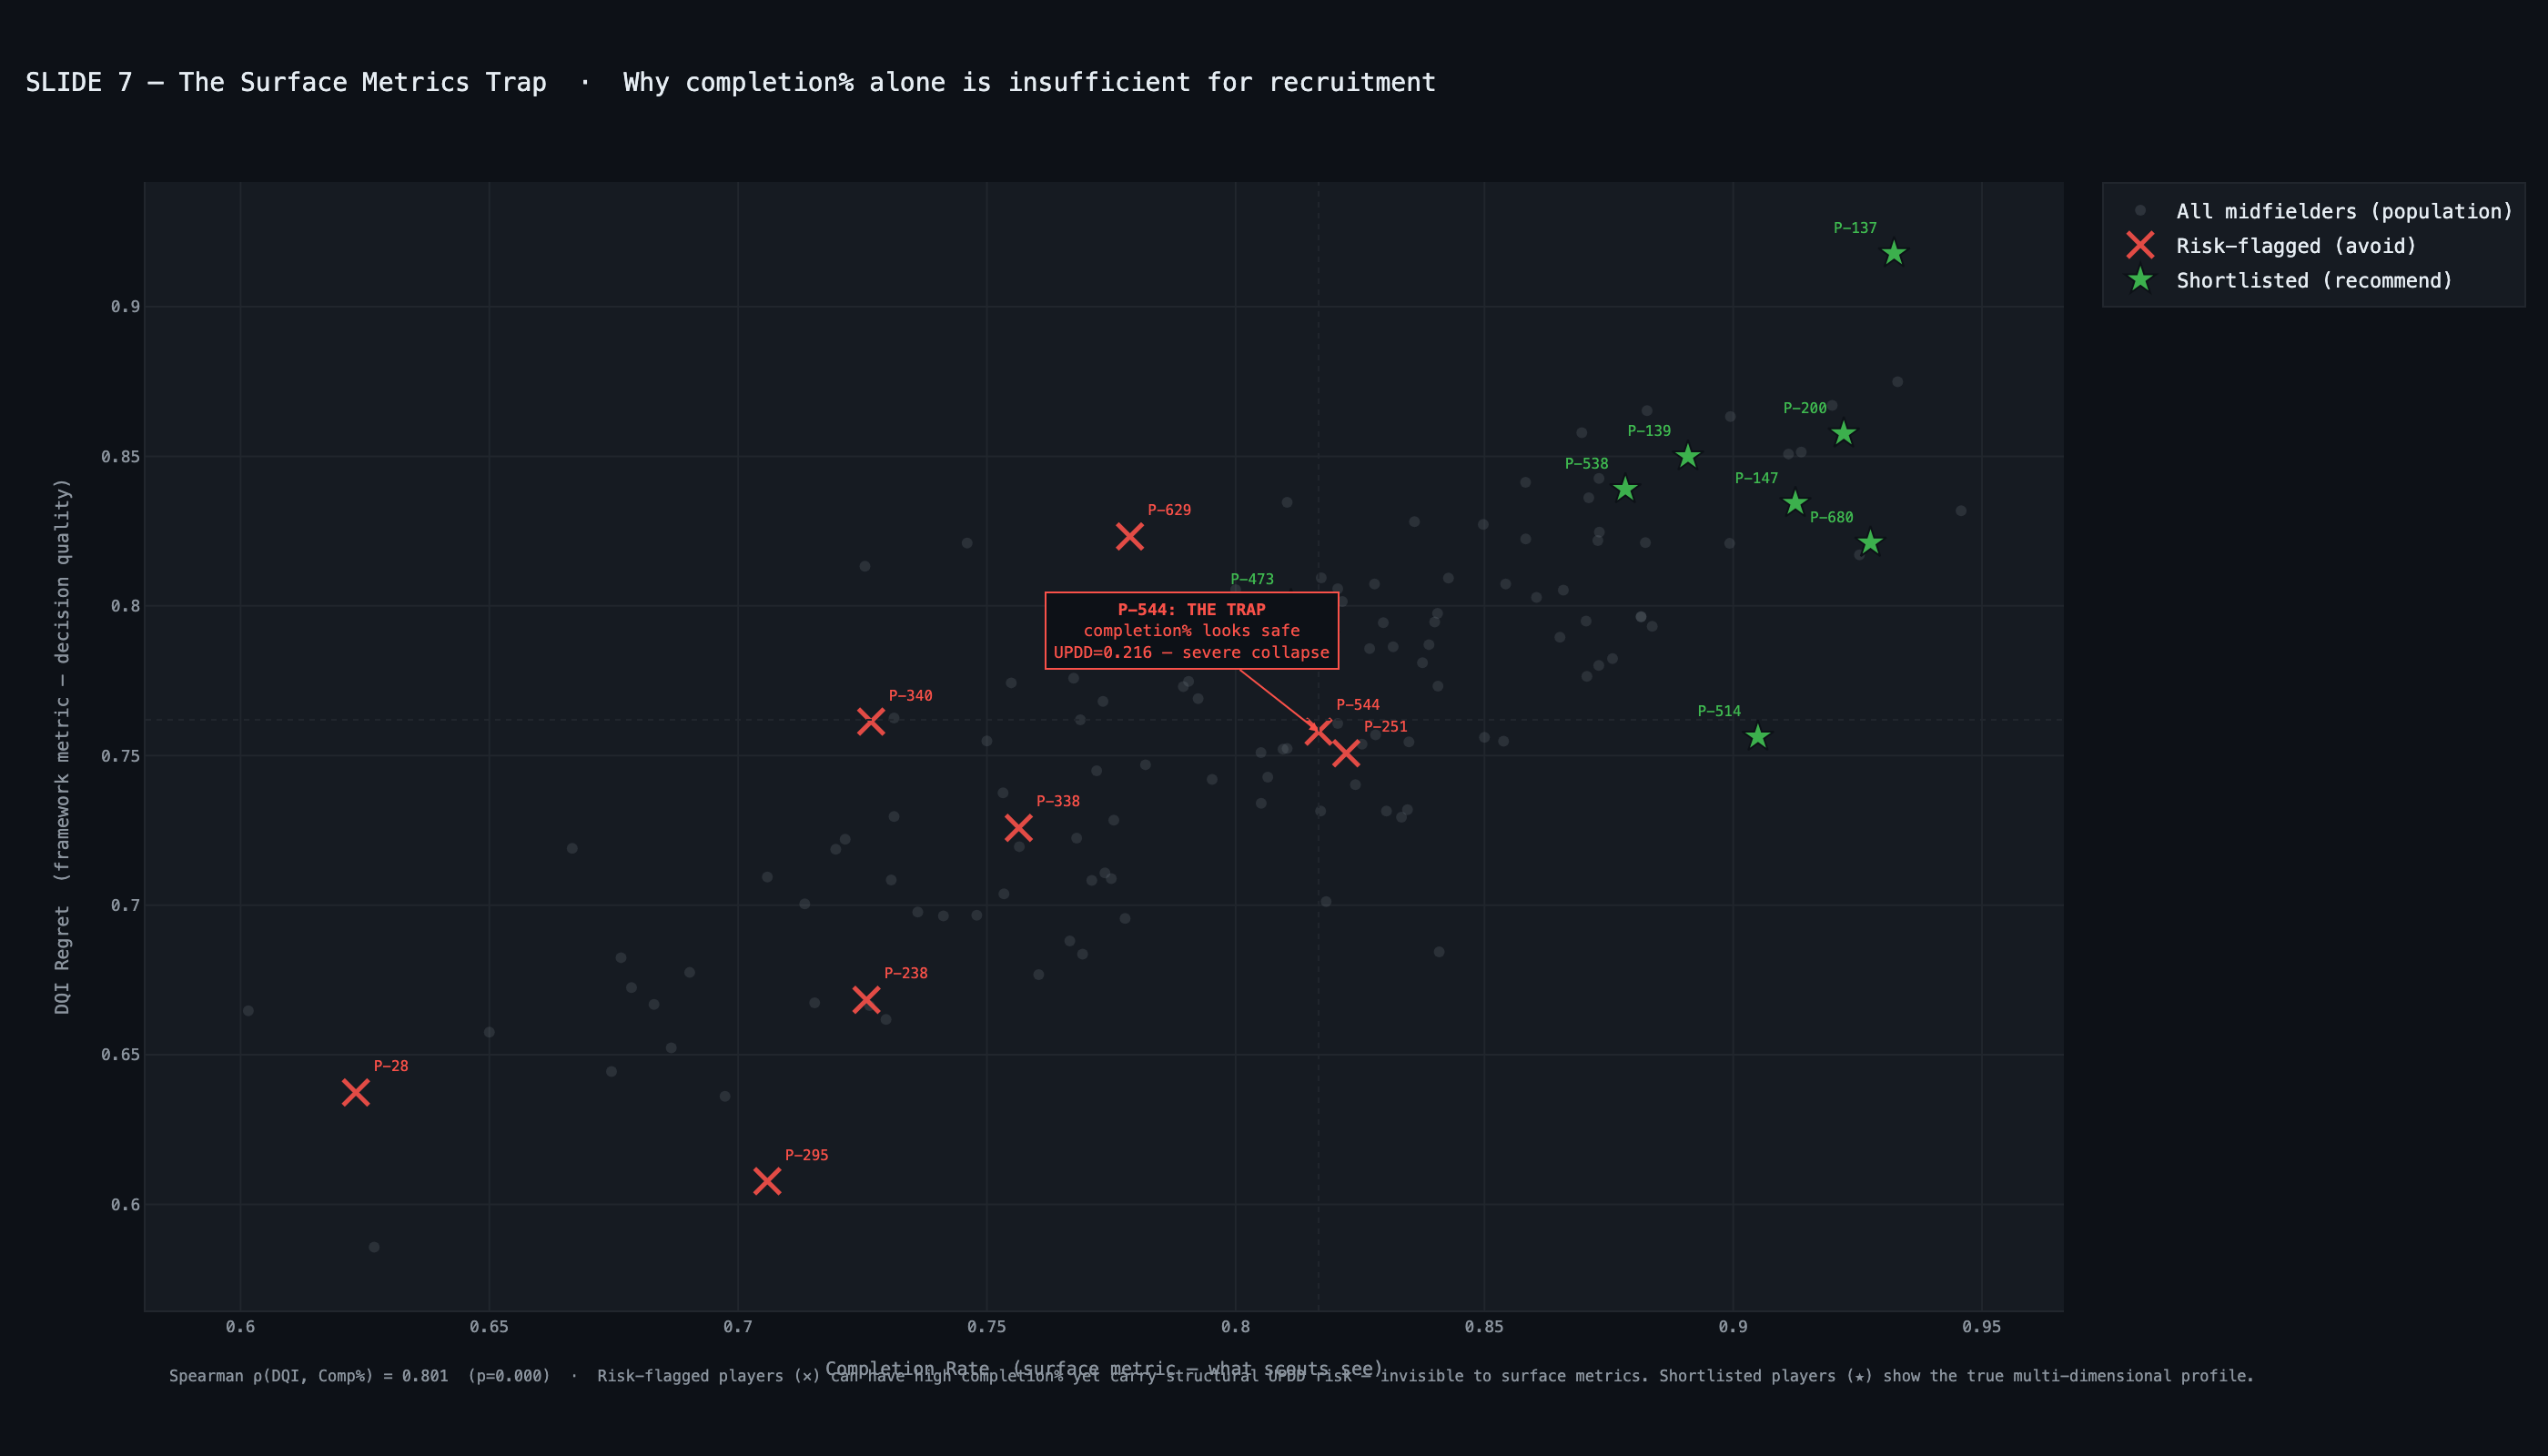
UPDD — Transfer risk signal

Under-Pressure Decision Degradation

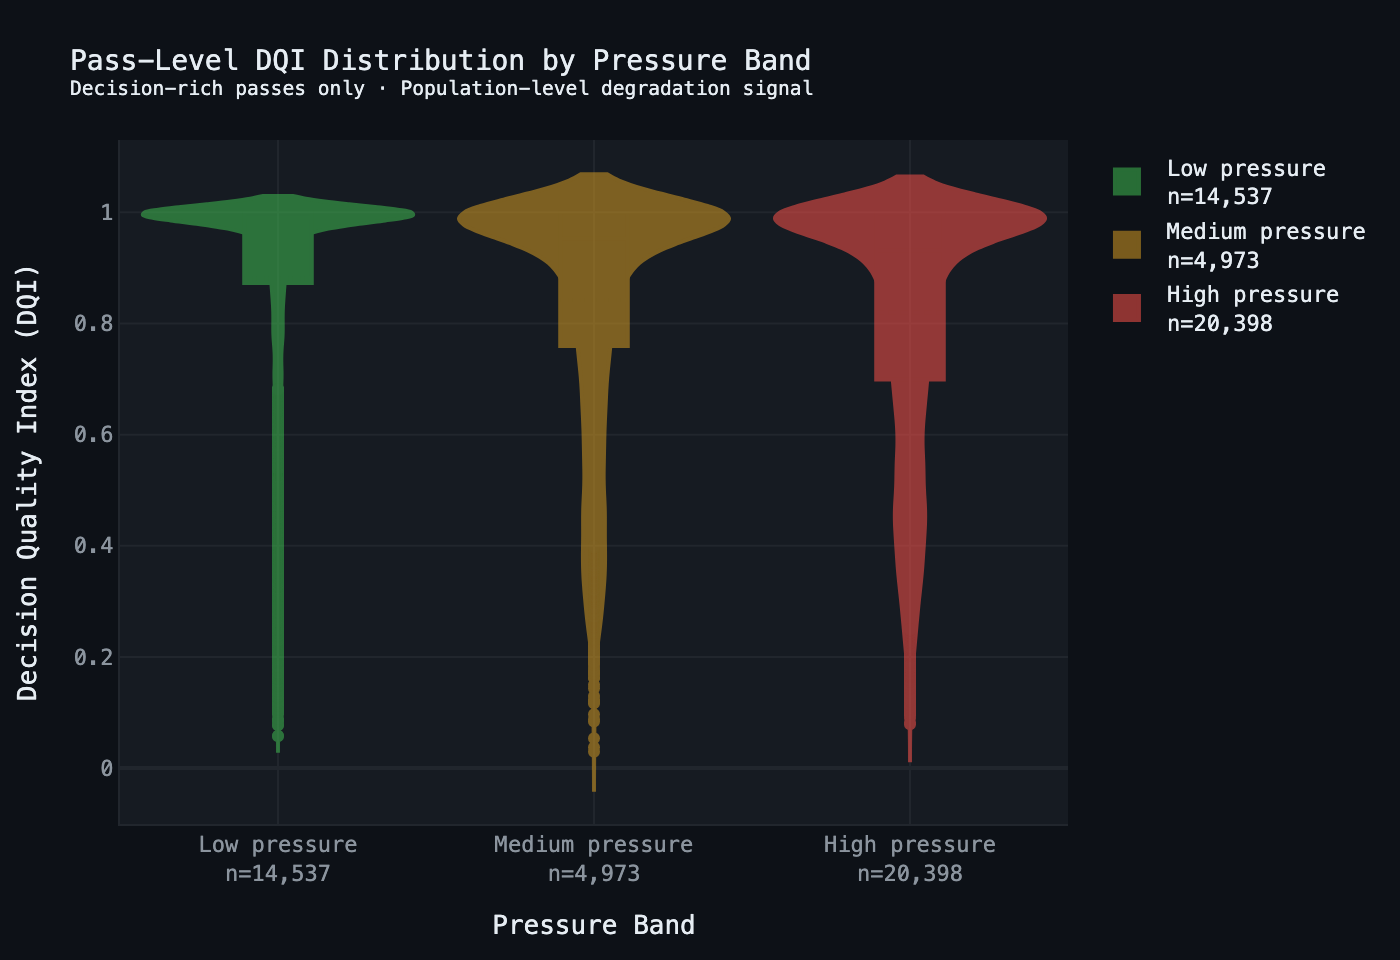
$$UPDD = \overline{DQI}_{low} - \overline{DQI}_{high}$$
Requires ≥15 decision-rich passes per pressure band. Medium-pressure excluded — extremes only. Positive = quality drops. Negative = player improves under pressure (pressure-resilient).
Tiers: Resilient (<0) · Neutral (0–0.10) · At-Risk (0.10–0.15) · High-Risk (>0.15). Unknown reported for 24.9% with insufficient band coverage — not imputed neutral. Cohen's d ≈ 0.556.
ROER — Movement awareness

Run-Option Exploitation Rate

$$ROER = \frac{\sum \mathbf{1}[\text{exploited} \mid \text{opportunity}]}{\sum \mathbf{1}[\text{opportunity}]}$$
Opportunity: ≥1 active run AND best running OVS > chosen OVS + τ (τ=0.02). Exploitation: chosen receiver had activeRun=True from passTargets.
τ removes trivial dilemmas. Positional gradient confirmed (K-W p<0.05): Def 0.226 → CMid 0.330 → Fwd 0.380–0.452. Position z-scoring mandatory. Partial r(DQI | completion%) = −0.052 — orthogonal after confounder removal.
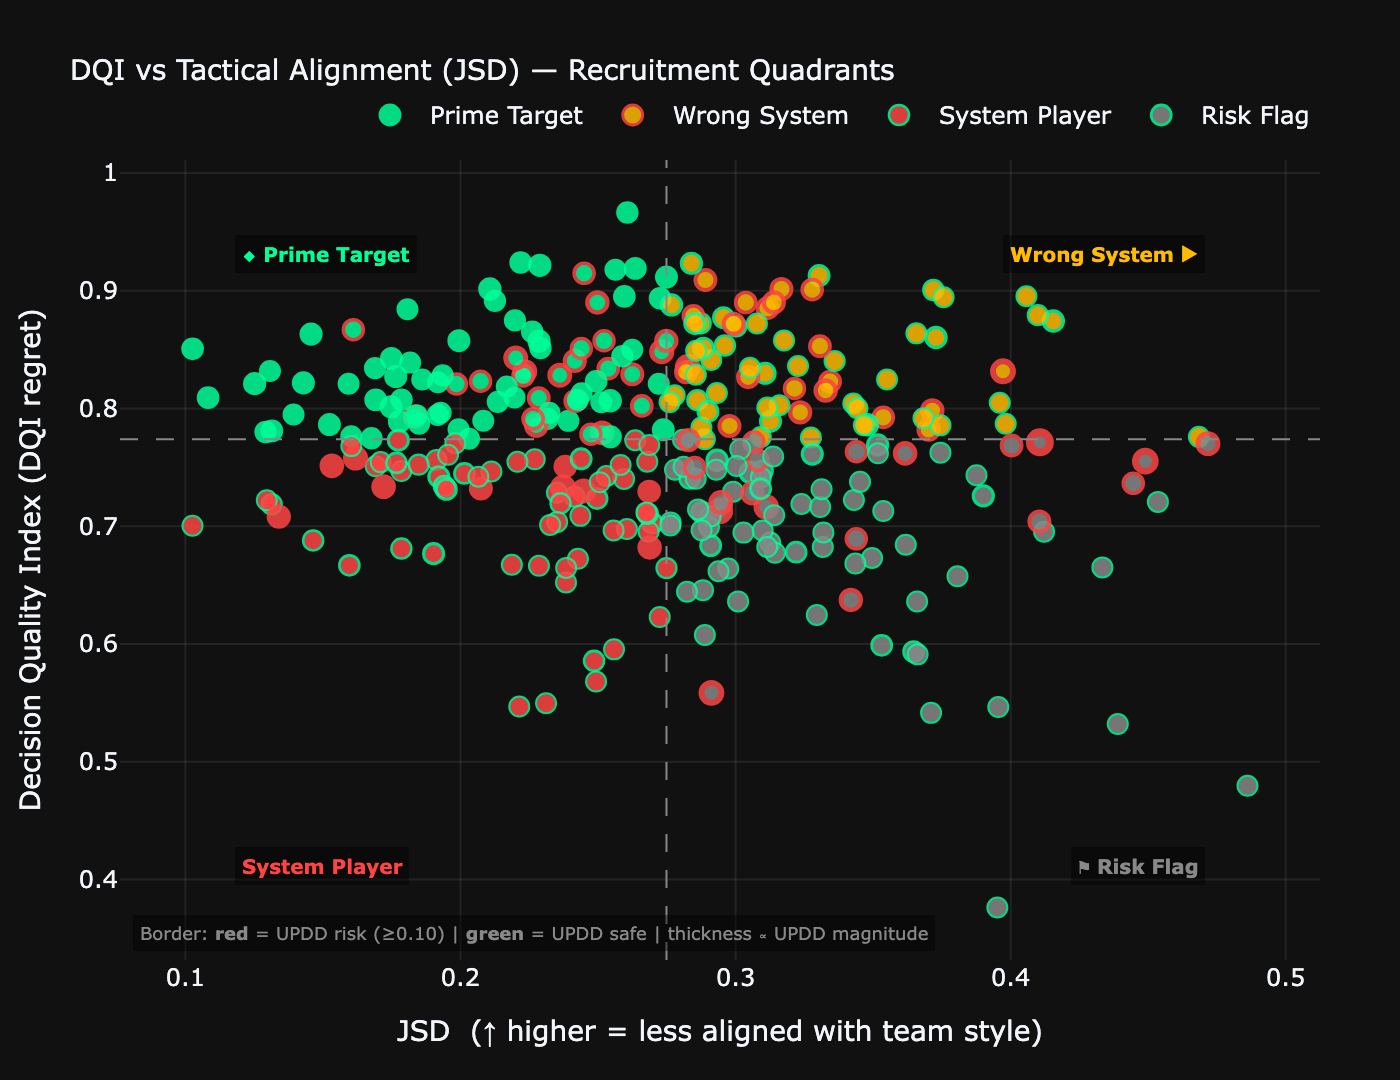
JSD — Tactical fit

Jensen-Shannon Divergence

$$JSD(P \| Q) = \frac{1}{2}D_{KL}(P \| M) + \frac{1}{2}D_{KL}(Q \| M)$$$$M = \frac{P+Q}{2}$$
P = player's phase-conditional passing distribution; Q = target system profile. JSD ∈ [0,1]; 0 = perfect alignment. Symmetric and bounded — advantages over raw KL divergence.
Orthogonal to DQI: |r| = 0.131 (target <0.40 ✓). C.Mids most aligned (0.218); wide fwds most divergent (0.310). Split-half r = 0.560 / SB = 0.718.
POR — Structural ambition

Progressive Override Rate

$$POR_z = z\!\left(\frac{\sum \mathbf{1}[\text{structural override}]}{\sum \mathbf{1}[\text{decision-rich}]}\right)$$
Three simultaneous conditions: (a) chose below-maximum OVS, (b) structurally ambitious (LBP ≥ 1 OR progressive gain > 0.65), (c) genuine dilemma existed. z-scored within position group.
Orthogonal to DQI: r = −0.036 (p = 0.91). Measures deliberate structural ambition — sacrificing expected value for a line-breaking pass when a genuine alternative existed.
OVS weight sensitivity analysis
OVS weight sensitivity — rankings invariant to perturbation
Spearman ρ = 0.984–0.997 across baseline, safety_heavy, and balanced weight scenarios. The threat_heavy scenario (w_T = 0.70) excluded — dilemma filter collapses to 57.8% event coverage.

Validation

Pre-registered. Independently confirmed.

All four hypotheses pre-registered before Stage 2 analysis. Pre-registration prevents post-hoc recalibration and preserves submission credibility. Every validation test ran against its pre-specified target and passed.

H1 — UPDD
31.9%
Target: ≥15% above UPDD > 0.15
High-volume progressors with structural pressure fragility — invisible in standard screens.
H2 — DQI
ΔR²=0.071
Target: ΔR² ≥ 0.05 over completion%
DQI explains independent variance in xThreat prediction. Gap widens sharply under high pressure.
H3 — ROER
Gradient ✓
Target: Fwds > Mids > Defenders
Def 0.226 → CMids 0.330 → Fwds 0.380–0.452. Kruskal-Wallis p < 0.05.
H4 — JSD
|r|=0.131
Target: |r| < 0.40 vs DQI
Tactical alignment is orthogonal to decision quality. JSD is not a proxy for DQI.

Full validation suite — 14/14 tests passed

Results reported as-computed with no post-hoc recalibration.

Validation testResultTargetStatus
DQI split-half reliabilityr = 0.748 / SB = 0.856≥ 0.70
DQI temporal stabilityr = 0.766≥ 0.65
DQI ΔR² over completion%0.071≥ 0.05
External criterion (turnover under pressure)ρ = −0.642, r_rb = −0.858, p < 0.0001ρ < 0, large effect
Turnover dose-response Q1→Q433.8% → 26.0% → 20.9% → 17.5%Monotonic
OVS weight sensitivity (rank stability)ρ = 0.984–0.997Stable
OVS collinearity (xP ↔ xT)Scale ratio within safe rangeNon-redundant
JSD split-half / SB-correctedr = 0.560 / SB = 0.718≥ 0.50
JSD cross-match stabilityStable across match sampleStable
JSD position sensitivity (Kruskal-Wallis)C.Mids 0.218 vs Wide Fwds 0.310Significant p < 0.05
ROER positional gradient0.226 → 0.330 → 0.380–0.452Gradient confirmed
ROER ↔ DQI orthogonality (partial r | completion%)r = −0.052, p = 0.487Non-significant
DQI ↔ JSD orthogonality|r| = 0.131< 0.40
DQI ↔ POR_z orthogonalityr = −0.036, p = 0.91Non-significant
Metric independence heatmap
Metric independence — pairwise Spearman correlations
All five metrics statistically orthogonal. ROER ↔ DQI raw r = −0.328 resolved by partial r = −0.052 after removing completion% confounder. Independence is empirical, not constructed by design.
ROER correlation decomposition
ROER correlation decomposition — confounder identified and resolved
Raw ROER ↔ DQI correlation entirely explained by shared relationship with completion%. After confounder removal: partial r = −0.052 (p = 0.487). Zero redundant information.
Cross-match stability
DQI reliability and cross-match stability
Split-half r = 0.748 (SB = 0.856). Temporal r = 0.766. Mean CV = 0.061 across 150 multi-match players — 89% below CV = 0.10. Signal stabilises at ≥2 matches.
DQI × JSD quadrant
DQI × JSD quadrant coherence
Q1 Elite Aligned (n=87): completion% 86.6%. Q4 Risk Flag (n=87): 72.7%. Mann-Whitney p < 0.0001. A player can have high DQI and high JSD — the two dimensions are genuinely orthogonal.
"Players in the lowest DQI quartile lose possession under pressure at nearly twice the rate of players in the highest quartile (33.8% vs 17.5%). Decision quality under pressure is measurable, stable, and consequential."

Recruitment Application

The four-layer filter hierarchy

A structured multi-layer filter, not a ranking algorithm. Apply layers in sequence — each eliminates noise before the next. The output is a ranked shortlist with auditable evidence for every flag. Every recommendation traces to a logged pass event.

Layer 01
DQI
Screen decision quality. Validated against high-pressure turnover (ρ = −0.642). Split-half reliable (r = 0.748). Minimum 30 decision-rich passes. Every DQI score links to inspectable pass clips — close the loop between quantitative signal and human judgement.
● Green ≥ Prime threshold
● Amber Watchlist — investigate
● Red Caution — below threshold
Layer 02
UPDD
Pressure robustness audit. 31.9% of qualified players amber or red — invisible in standard screens. Do not sign into a high-pressing system with UPDD > 0.15 without targeted video verification of high-pressure sequences.
● ≤ 0.10 Robust — proceed
● 0.10–0.15 Amber — monitor
● > 0.15 Structural fragility — Flag
Layer 03
JSD
Tactical style-fit check. Compare player's phase-conditional passing distribution vs target system profile. High JSD is not a veto — it is an obligation to ask: will this player's decision patterns survive a system change?
● < p50 Well aligned
● p50–p66 Moderate divergence
● > p66 Misalignment — investigate
Layer 04
ROER
Run-option exploitation. Always compare within position group. A forward at ROER < 0.25 is a red flag. A defender at ROER = 0.35 is elite. ≥10 opportunities = reliable ranking. ≥5 = provisional.
● Top third High exploiter
● Mid third Monitor
● Bottom third Low exploiter
Adaptation Index — composite shortlist signal
$$AI = 0.50 \cdot \text{norm}(DQI) + 0.35 \cdot (1 - \text{norm}(UPDD)) + 0.15 \cdot \text{norm}(ROER)$$
All components normalised to [0,1] using population min/max. DQI carries most weight (50%); pressure robustness second (35%, inverted); ROER movement signal (15%). Higher AI = safer to sign.
⬟ Prime — all three conditions met ◆ Watchlist — one risk dimension ◇ Caution — below DQI threshold ⚑ Flag — UPDD > 0.15 or compound misalignment
Scout tier overview
Population recruitment landscape — start here
DQI vs Transfer Risk Score. 309 players. Green Prime zone (top-left) = immediate shortlist priority. Size = pass volume (statistical confidence). Every player is one click from their underlying pass events.
UPDD × ROER risk matrix
UPDD × ROER — four operational profiles
Prime: press-robust movement exploiters. Safe Recycler: reliable possession anchors. Fragile Exploiter: skilled but fragile. Avoid: structural risk.
DQI × JSD tactical fit quadrant
DQI × JSD — quality vs tactical fit
Q1 Elite Aligned: target immediately. Q2 Good Wrong System: quality player, needs integration time. Q3 Fitted Poor Decisions: fits system but poor option selection. Q4 Risk Flag: compound misalignment — avoid.
Adaptation index ranking
Adaptation Index ranking — full population
All qualifying players ranked by composite AI. Tier colour-coded. Primary shortlist sort order — higher AI = safer acquisition. Transfer risk score provides complementary axis for risk-quality trade-off.
"The €30M mistake is visible before the transfer. This is what you need to see it."

Midfielder Use Case

Framework applied: 131 midfielders

A complete recruitment cycle applied to 131 qualifying midfielders. From population landscape to individual profiles to final scouting recommendations — every step uses only glass-box metrics, every flag traces to a logged pass event.

Slide 1
Population summary
131 midfielders · 51K events · key numbers at a glance
Slide 2
Framework overview
Five metrics, one decision architecture, glass-box guarantee
Slide 3
Top-9 shortlist table
Ranked by Adaptation Index with traffic-light profiles
Slides 4–5
Individual profiles
P-473, P-139, P-137, P-514, P-680, P-147 — full metric cards
Slide 6
Comparative landscape
Top-10 bar charts: DQI, UPDD, ROER, JSD with population benchmarks
Slide 7
Risk flags + surface trap
Eight flagged players — the completion% deception exposed
Slide 8
Recruitment matrix
DQI × UPDD quadrant with four acquisition profiles
Slide 9
Final recommendations
Four priority bands from Immediate Bid to Do Not Sign

Population landscape

Midfielder population cover stats
131 midfielders — entry statistics
Only players with ≥30 decision-rich passes qualify for shortlisting — ensuring all rankings are statistically reliable. Sample depth is shown alongside every metric.
Recruitment decision matrix
Recruitment matrix — DQI × UPDD quadrant
Four zones: Prime Targets (high DQI + low UPDD), High Quality Risk, Safe Recyclers, Avoid. ROER tier encoded as marker symbol (★ high · ● mid · ✕ low · ○ unknown). Start every scouting conversation here.

Top-9 shortlist — Adaptation Index ranked

Midfielder shortlist top 9
Top-9 candidates with traffic-light profiles
Ranked by Adaptation Index. Traffic lights: DQI · UPDD · JSD · ROER — ● green = strong, ● amber = moderate, ● red = risk, ○ = insufficient data. Every flag traces to a specific logged event.

Tier 1 profiles

P-473
Elite Pressure Immune · Max ROER Exploiter
Adapt. Index0.853
DQI
0.800
71st pct
UPDD
−0.190
98th pct ↑
JSD
0.344
High misalign
ROER
1.000
99th pct

    Strengths

  • Strongest pressure immunity in population (UPDD = −0.190)
  • 100% run exploitation — maximises teammate movement
  • 80 decision-rich events, 4 matches — reliable sample

    Risks

  • JSD = 0.344 — requires system fit assessment
  • Watchlist tier: style divergence, not quality concern
Box-to-box / press-resistant progressorBUY — pending JSD review
P-139
High DQI · Maximum ROER · UPDD Unknown
Adapt. Index0.754
DQI
0.850
93rd pct
UPDD
N/A
Requires data
JSD
0.262
65th pct
ROER
1.000
99th pct

    Strengths

  • 93rd pct DQI — elite decision-maker by population standards
  • ROER = 1.000: all run opportunities converted
  • Prime tier — passes all core quality thresholds

    Risks

  • UPDD unknown — insufficient high-pressure events
  • 3 matches only; borderline sample reliability
  • JSD amber — manageable with coaching
Advanced midfielder / high-IQ link playerPRIME — extended observation
P-137
Highest DQI in Population · Safe Recycler Profile
Adapt. Index0.734
DQI
0.918
100th pct
UPDD
−0.070
18th pct ↑
JSD
0.256
63rd pct
ROER
0.000
9th pct ↓

    Strengths

  • Absolute highest DQI in 131-player population
  • UPDD = −0.070: quality improves under pressure
  • 95 decision-rich events — largest reliable sample in top 6

    Risks

  • ROER = 0.000 — does not exploit off-ball runs
  • Wrong profile for high-tempo pressing systems
  • Safe Recycler: structured possession systems only
Regista / deep-lying playmakerHIGH PRIORITY — map to system

Tier 2 profiles

P-514
Cleanest Risk Profile · Volume Leader
Adapt. Index0.723
DQI
0.756
47th pct
UPDD
−0.171
3rd pct ↑↑
JSD
0.191
31st pct
ROER
0.455
69th pct

    Strengths

  • Lowest transfer risk score in shortlist (0.178)
  • 173 events — highest statistical confidence in cohort
  • Green UPDD + JSD: pressure-safe AND tactically flexible

    Risks

  • DQI 47th pct — safe but not elite decision-maker
  • Watchlist due to DQI ceiling, not behavioural fragility
Reliable ball-circulation engineSTRONG BUY — low-risk profile
P-680
Strong DQI · Exceptional Pressure Immunity · Best System Fit
Adapt. Index0.722
DQI
0.821
82nd pct
UPDD
−0.167
4th pct ↑↑
JSD
0.159
12th pct
ROER
0.100
19th pct ↓

    Strengths

  • JSD = 0.159 — best tactical fit in entire top 6
  • 218 decision-rich events — most data-rich in shortlist
  • UPDD = −0.167: thrives under pressure

    Risks

  • ROER = 0.100 — does not convert run opportunities
  • Not suited to high-movement play
Composed deep-lying playmaker / possession anchorPRIORITY — control systems only
P-147
Balanced Profile · High Run Exploitation
Adapt. Index0.716
DQI
0.834
89th pct
UPDD
0.013
52nd pct
JSD
0.169
18th pct
ROER
0.667
90th pct

    Strengths

  • 89th pct DQI + 90th pct ROER — elite on two dimensions
  • JSD = 0.169: high tactical adaptability
  • Prime tier — passes all thresholds with margin

    Risks

  • UPDD neutral (0.013) — no pressure premium (not negative)
  • 3 matches only — flag for additional observation
Dynamic box-to-box / run-activating rolePRIME TARGET — outstanding value

Comparative metric landscape

Comparative metric landscape
Top-10 comparative bar charts — DQI, UPDD, ROER, JSD
Population average shown as vertical reference line on each panel. P-137 leads DQI (0.918). P-473 and P-514 lead UPDD resilience. P-473 and P-139 lead ROER. P-680 leads tactical fit (JSD = 0.159).
Spider radar top 6
Five-axis radar — top 6 profiles compared on all dimensions
DQI · UPDD · JSD · ROER · POR_z. Metric orthogonality is visually evident — players with near-identical DQI look radically different across the other four dimensions. This is the profile, not the number.

The surface metrics trap

The most operationally dangerous finding in the dataset. Several players pass standard completion% screens but fail the framework. P-544 is the canonical example of the trap.

Risk flags table
Risk flags — eight players to avoid
Sorted by risk severity. P-28: triple flag. P-544: UPDD = 0.216 despite completion% passing standard screens — the definitive surface metrics trap case.
Surface metrics trap scatter
P-544 annotated — the €Xm mistake
P-544 sits in the "safe" completion% range but carries UPDD = 0.216 — severe pressure collapse. Green stars = shortlisted. Red crosses = flagged avoid. Standard scouting would sign P-544.
PlayerTierDQIUPDDJSDROERPrimary risk reason
P-28Flag0.6370.1670.3420.400Triple flag: pressure fragile + style misalignment + below-threshold DQI
P-340Flag0.7610.0780.3280.000Style misalignment (JSD=0.328) + zero run exploitation
P-338Flag0.7260.0830.3900.400High JSD (0.390) + below-threshold DQI
P-544Flag0.7580.2160.1620.500THE SURFACE TRAP: completion% looks safe — UPDD = 0.216 severe collapse
P-251Flag0.7510.1070.2380.000Pressure fragile + zero run exploitation
P-629Flag0.8230.1060.2070.000High DQI but pressure fragile + zero run exploitation

Final scouting recommendations

Final scouting recommendations
Four-band priority output — every recommendation anchored to metric evidence
Immediate bids · Extended observation · Pending JSD audit · Do Not Sign. Each tier defined by specific metric conditions, not analyst judgement.
● PRIORITY 1 — IMMEDIATE BIDS
P-147
0.716
89th pct DQI + 90th pct ROER + green JSD — balanced elite with no single weakness. Most defensible immediate bid in dataset.
P-538
0.708
Prime flag confirmed. Green UPDD + green JSD + ROER=50%. Strongest validated prime target across all thresholds.
P-514
0.723
Transfer risk score 0.178 — lowest in entire cohort. 173 events: highest statistical confidence. Safest acquisition profile available.
● PRIORITY 2 — EXTENDED OBSERVATION REQUIRED
P-139
0.754
DQI 93rd pct + ROER=1.000 but UPDD unknown. Flag for 5-match extension to classify pressure profile before bid.
P-137
0.734
Highest DQI in population (0.918) + UPDD resilient. ROER=0.000 requires system mapping: ideal regista; wrong profile for pressing systems.
P-680
0.722
82nd pct DQI + best tactical fit (JSD=0.159) + UPDD resilient. ROER red — ideal possession anchor; confirm system fit before bidding.
● WATCH — PENDING JSD SYSTEM FIT AUDIT
P-473
0.853
Highest adaptation index in entire 131-player population. UPDD=−0.190 (elite) + ROER=1.000 (elite). Flagged solely for JSD=0.344. If system fit confirmed: single highest-value target in dataset.
⚑ DO NOT SIGN
P-28
0.607
Triple flag: pressure fragile (UPDD=0.167) + style misalignment + below-threshold DQI.
P-544
0.495
THE SURFACE TRAP: completion% >75% but UPDD=0.216 — severe pressure collapse. Standard scouting flags as safe. Framework correctly identifies structural risk.

Access

Explore the full framework

Download the complete technical report, launch the interactive app, or review the analysis pipeline. Every claim is reproducible from the source notebook.

Technical Report (PDF)
Complete methodology, all metric derivations, full validation tables, pre-registered hypotheses, OVS architecture decisions, recruitment application guide, and analytical limitations. Includes appendices on AAS→ROER transition and JSD implementation.
Download Report
Interactive App
Explore the recruitment landscape, filter players by metric tier, inspect individual decision profiles, navigate the DQI × JSD quadrant, and compare shortlisted players — built in Reflex with the full player_metrics dataset.
Launch App ↗
#
Source Notebook
Full pipeline — Colab notebooks with all metric computations, validation suites, and visualisation code. Built on Opta Vision MA36 / MA58 / MA60. All validation tests ran against pre-specified targets.
View on GitHub ↗

Scope & limitations

Scope: One competition, 50 matches — cross-league robustness is the priority extension.

Coverage: ROER reliable at ≥10 opportunities (41% provisional); UPDD uncomputable for 24.9% — reported as Unknown, not neutral.

By design: No reception quality, ball-carrying, or off-ball positioning. Analytical focus enables validation depth that broader frameworks cannot achieve.